automatic topology discovery to create tools for a next-generation network management system.Currently, the network management tools that exist today do not adequately monitor network components. There are a lot of events that can occur that can throw havoc into a network. For example, on election day, lots of web surfers go to election results sites causing unusual traffic flows through the network. This event is a one time event that could bring a network to its knees. The goal of this project is to monitor networks and detect when various components are not running normally and alerting the network administrator of this fact. It is unreasonable to expect a network administrator to check every node on a network so it is advantageous if the network administrator is alerted to nodes acting abnormally.
This work is going to be done by using scripts to log various network statistics and develop heuristics to define network stability. Eventually, this work will be tied into the work being done on
Real and end nodes on the internet which are heterogenous. This modularity allows for easy expansion in the future.The network monitoring tools were designed with portability and modularity in mind. The scripts used are written in PERL and can run under UNIX and WinNT. The data gathering script is separate from the presentation scripts allowing for different views of the data being added easily. It allows for the tools to be used in conjuction with simulators, such as
The script that gathers the data uses SNMP to query nodes on a network. Any type of node on a network can be used as long as it supports SNMP. Nodes that have been used in this project include computers running Windows NT Server and routers. The data gathering script reads in a list of nodes to monitor and then for each node, an input file of MIB entries to be monitored for that node is read in. The script then queries the node using SNMP for each of the MIB entries. The data is then all stored in a file using a pre-defined format. The file is named in the format: switching element-monthdayyear-hourmin.dat. Initially, the nodes are queried at a predetermined interveral. Currently, the default interval is 5 minutes.
Once the data has been collected, other scripts are run to parse and analyze the data. The scripts go through the data and for each hour, compute the min, the max, the mean, and the variance for a given MIB entry. If the script determines that the mean for a given hour varies from the average value over time by a given threshold (currently twice the standard deviation), then a warning message is logged in the log file and the script changes the interval in which the node is monitored.
There are other scripts that parse the data files. Currently, data can be converted to HTML or gnuplot graphs stored as gif's.
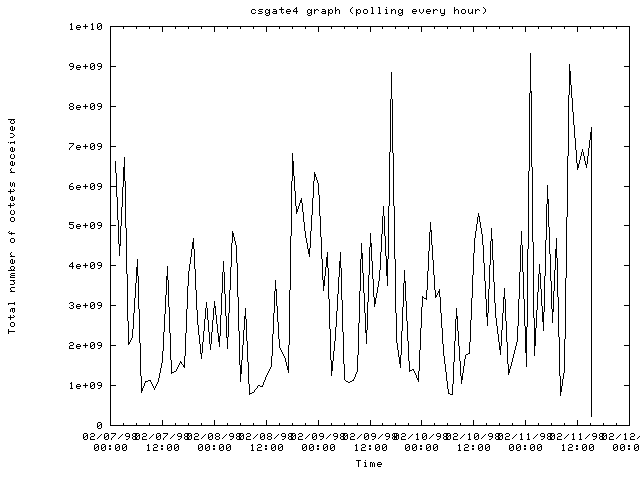
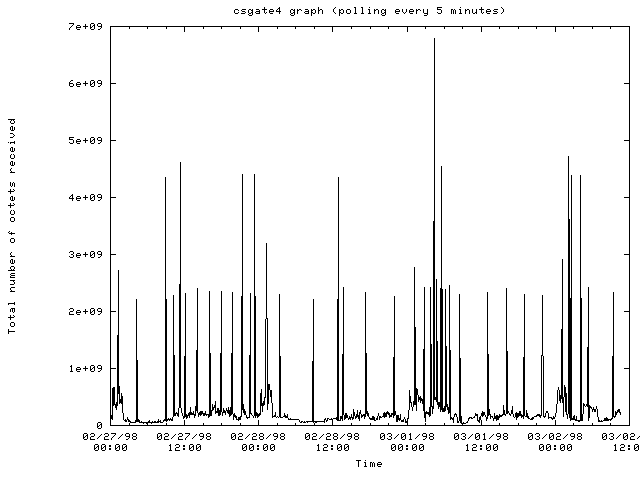
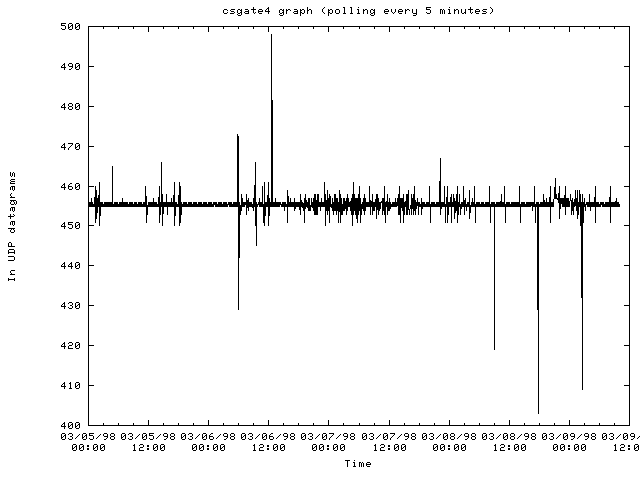
CSGate4.cs.cornell.eduBelow are HTML daily summaries of the in and out load measured as the number of bytes coming in and out of a router. The routers that have been surveyed are along the computer science's route in the Cornell network to the Cornell gateway.
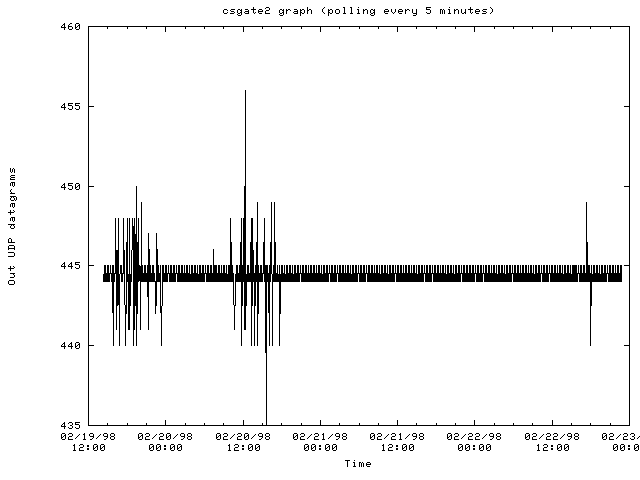
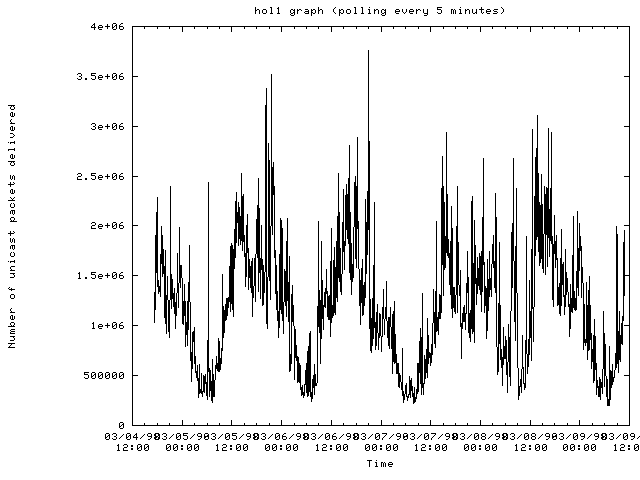
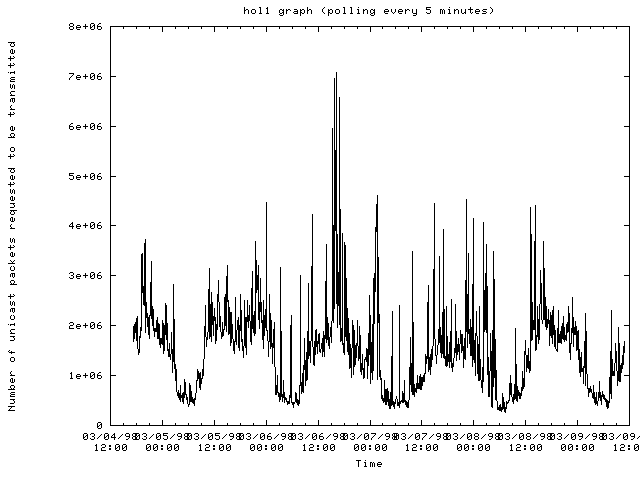
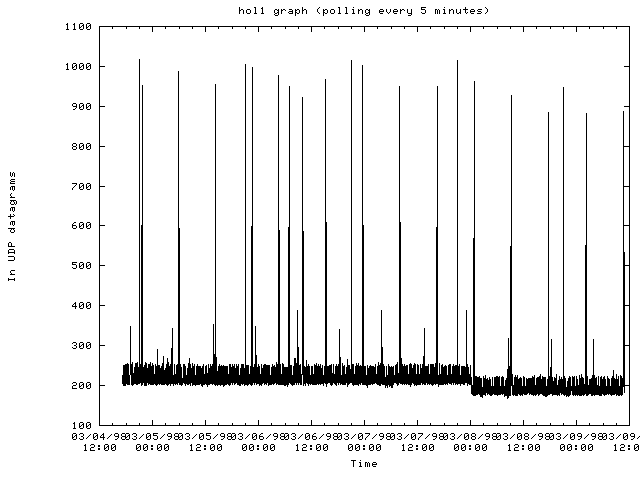
(2/19-23/98)The graphs below show various statistics plotted for different routers within the computer science department of Cornell and within the Cornell network. The graphs show data that was polled over 5 minute periods using SNMP early on in this project. These graphs were collected while the graphing tools were being created. The tools could still make these type of graphs but the current work above shows summaries of the bytes coming in and out of routers.
The router csgate2.cs.cornell.edu:
- Number of bytes transmitted:
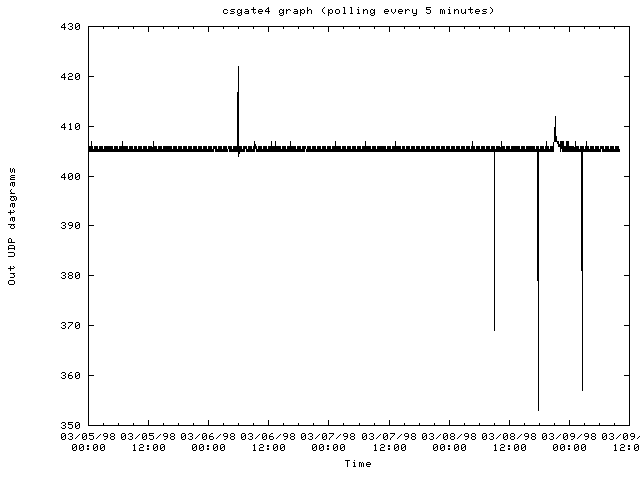
The router csgate4.cs.cornell.edu:
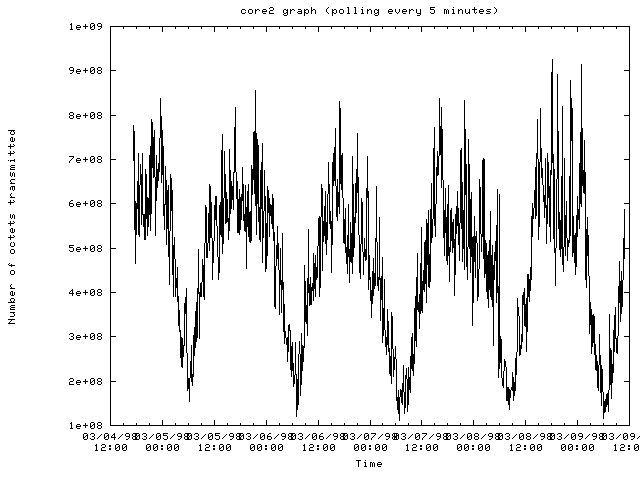
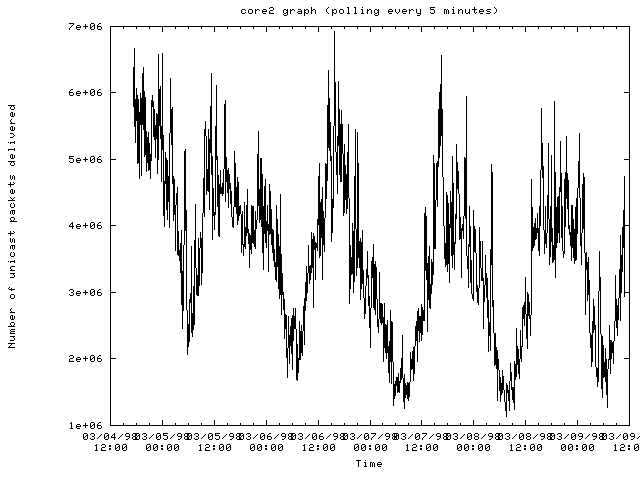
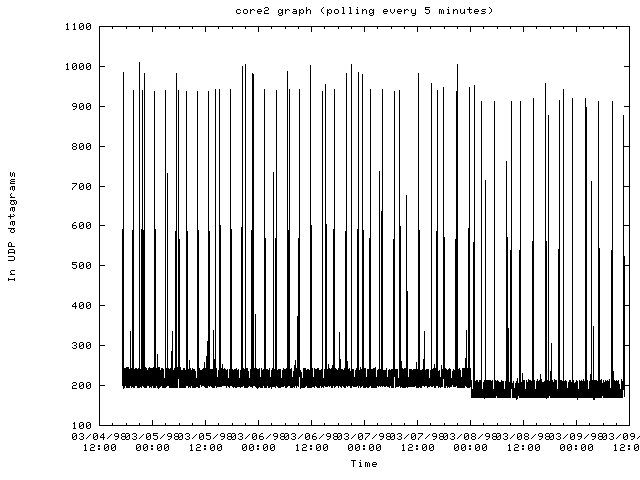
The router core2-mss.cit.cornell.edu:
The router hol1-mss.cit.cornell.edu:
(Jump to the index)
(Jump to the index)
- Traffic patterns on most routers are periodic where traffic drops off after midnight and then picks up again in the morning with a drop off for lunch and then dinner.
- When traffic gets heavy on a router, most of the SNMP requests are dropped making it difficult to determine any problems with the router. When this occurs, other means of monitoring a network node are needed.
Installation Guide/Readme in Word FormatSome of the documents here were prepared for non-web purposes. Because of the move to the web, some of the documents might be viewable within the browser. This is true with powerpoint slides and Internet Explorer.
(Jump to the index)
Internet Traffic Report for MCI's backbone.Here are some links that have been helpful in doing this project:
(Jump to the index)
Dr. S. Keshav and Rosen Sharma. The people working in this project are:This project is developed under the supervision of
(Jump to the index)
![]()
![]()
Russell Schwager
russells@cs.cornell.edu
May 16, 1998