Site Graph
A script for generating interactive website visualizations.
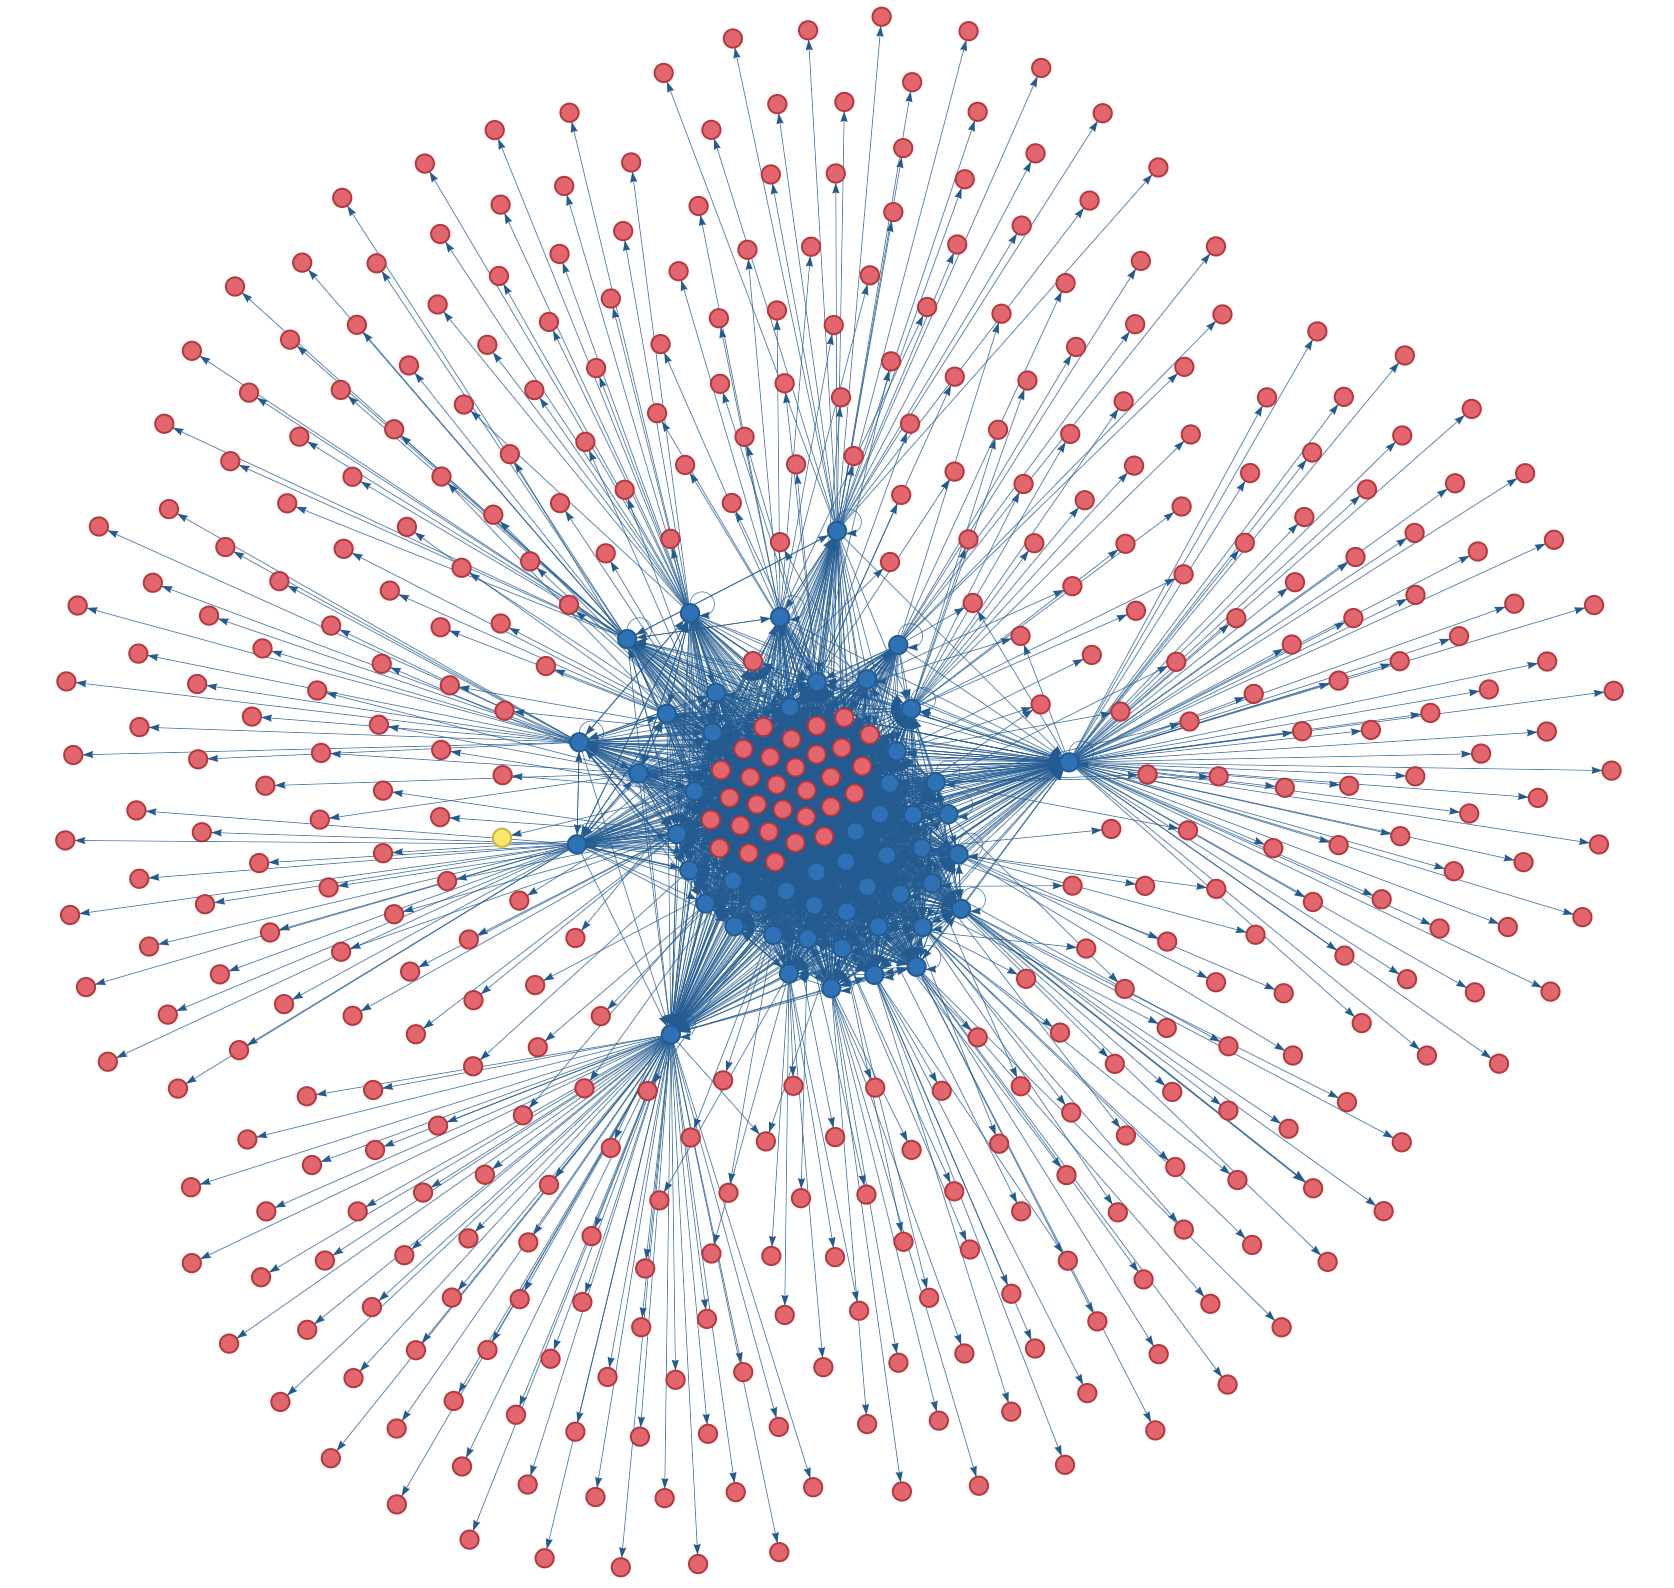
This is my website! (At the time of writing; for an up-to-date version, see the Site Graph page.)
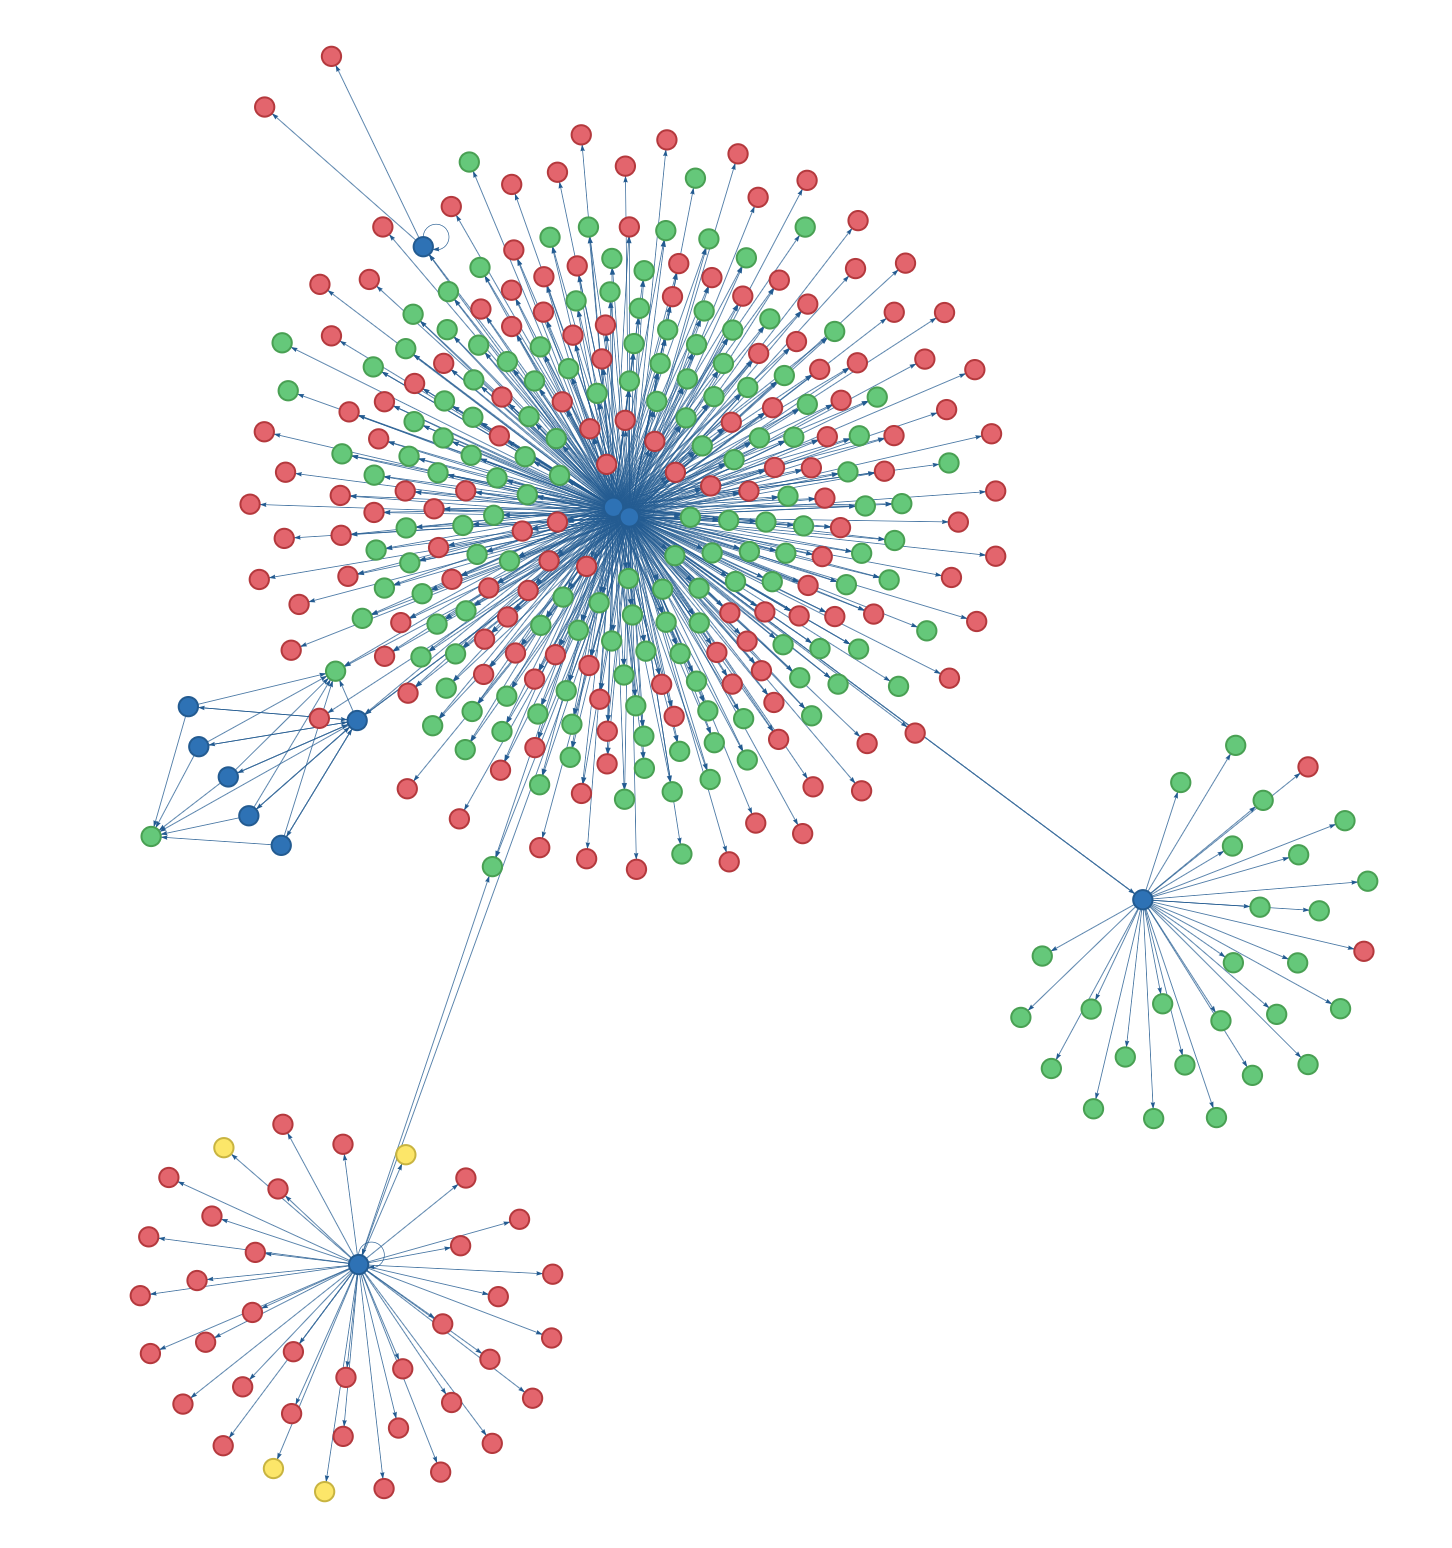
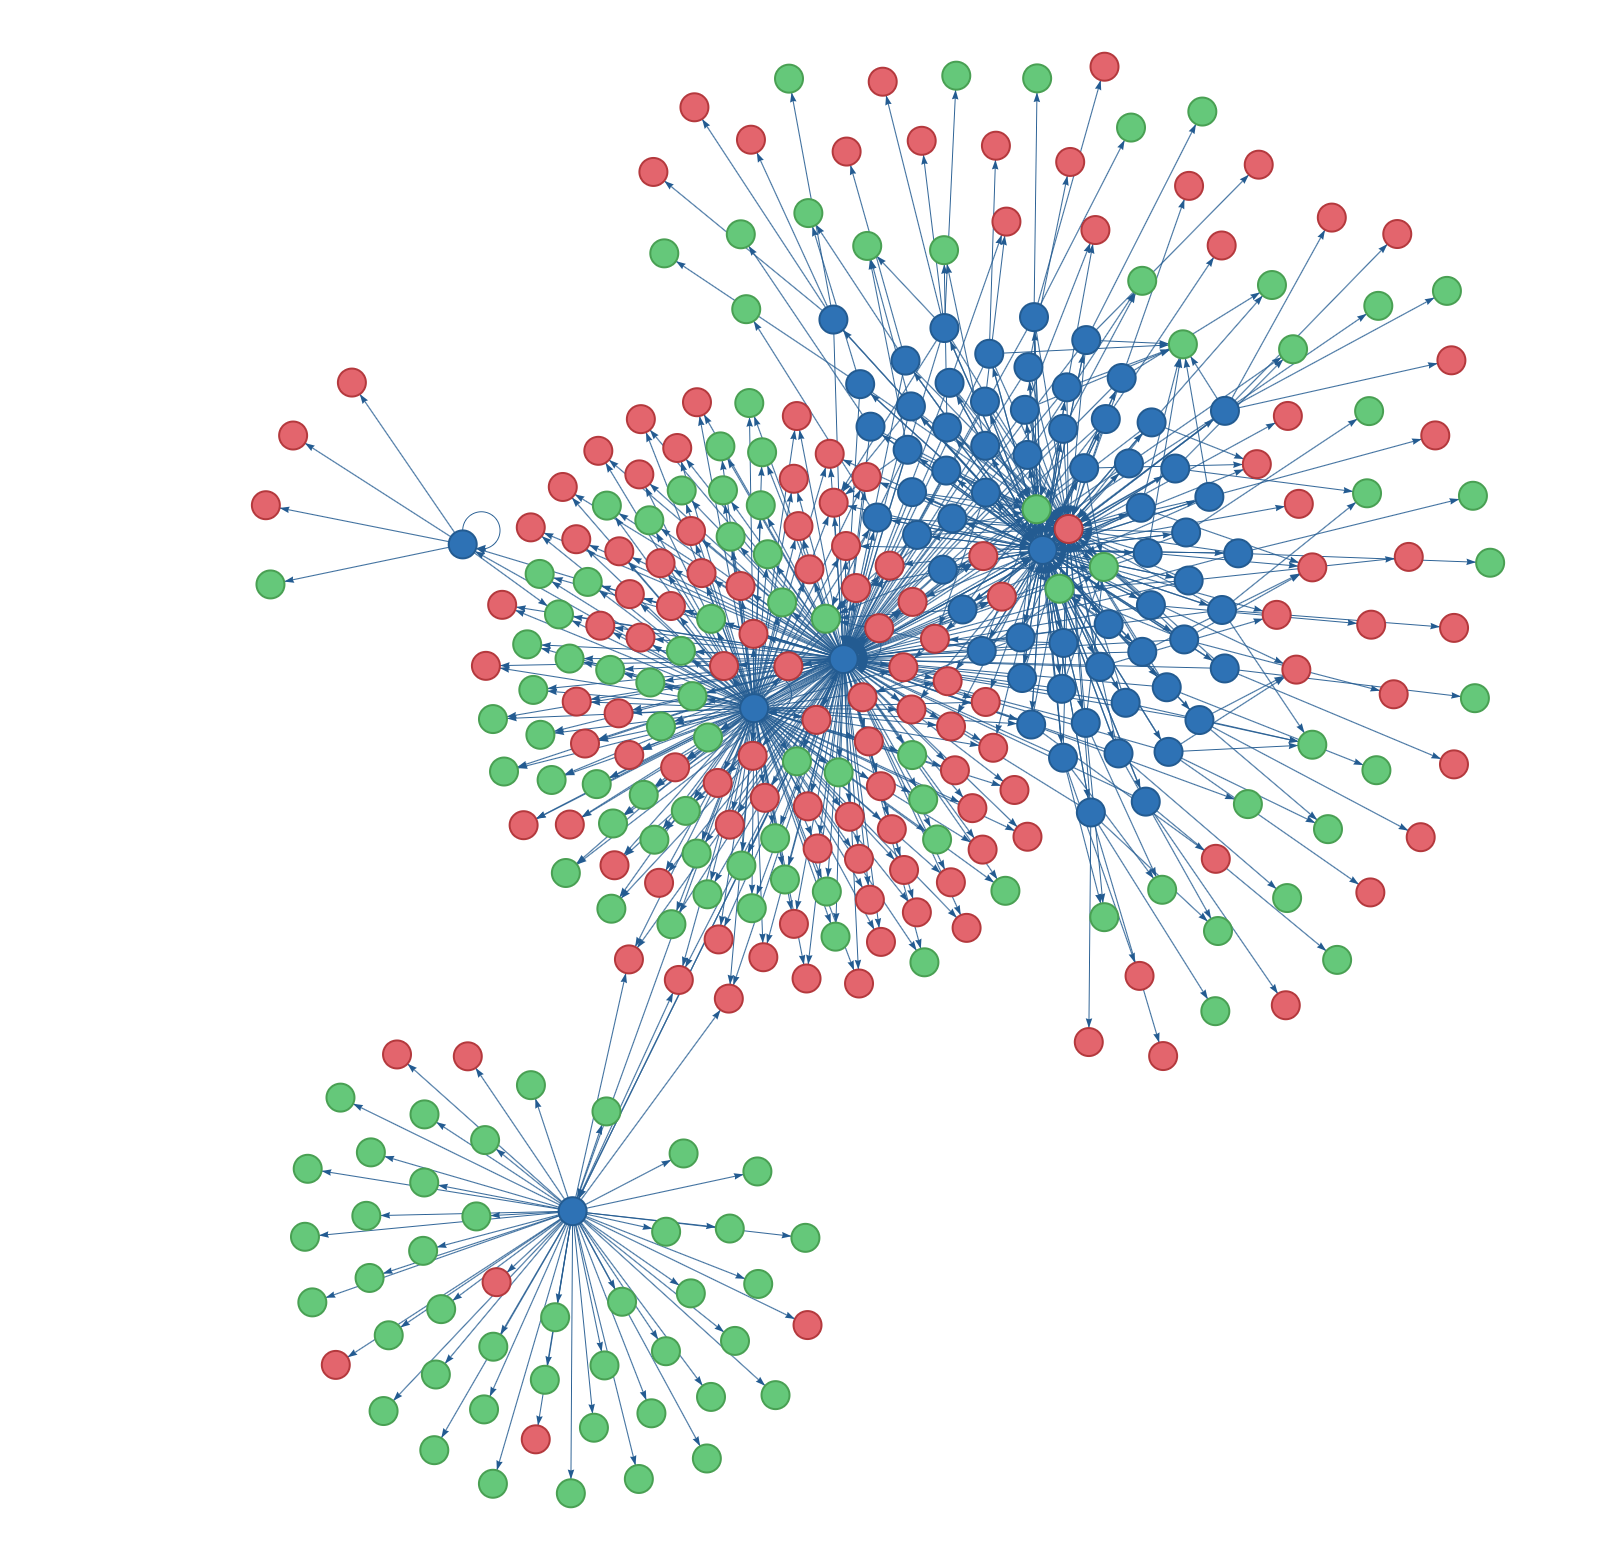
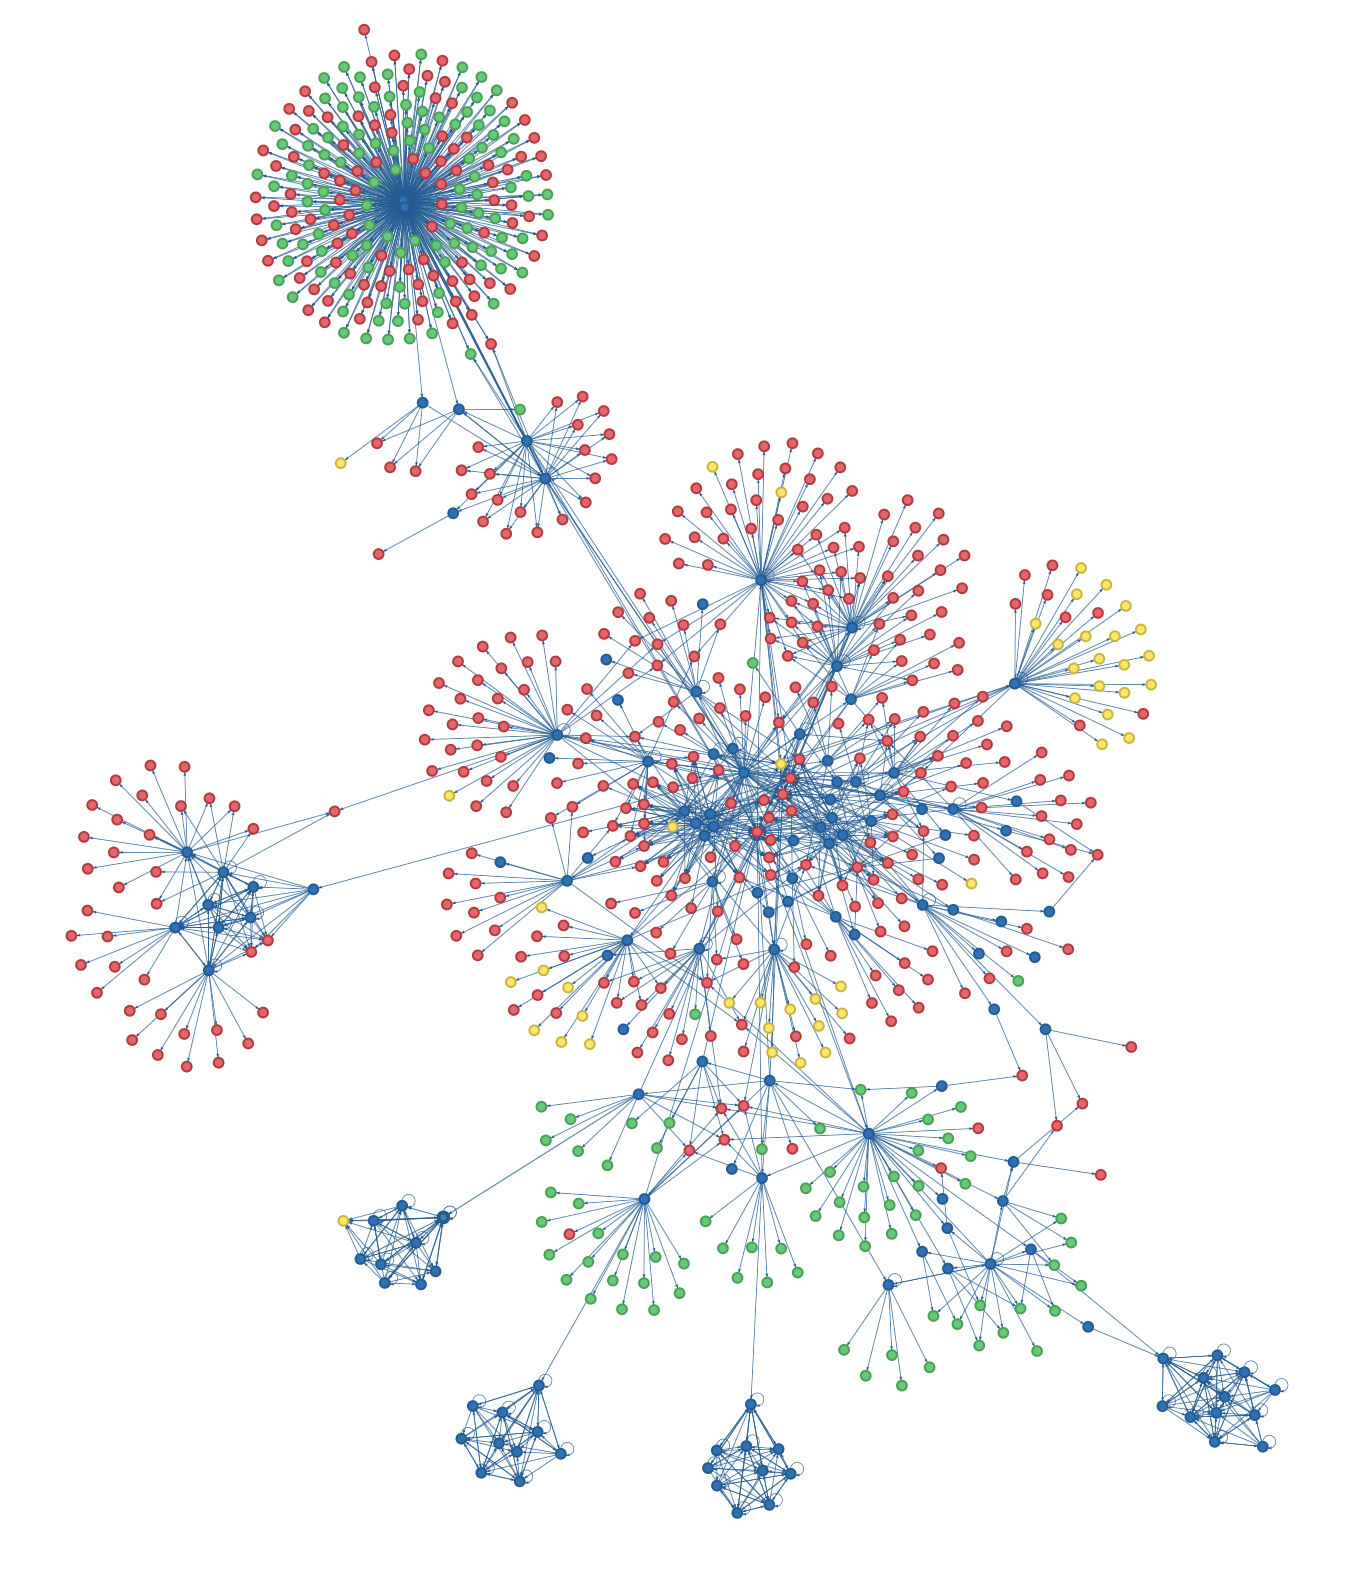
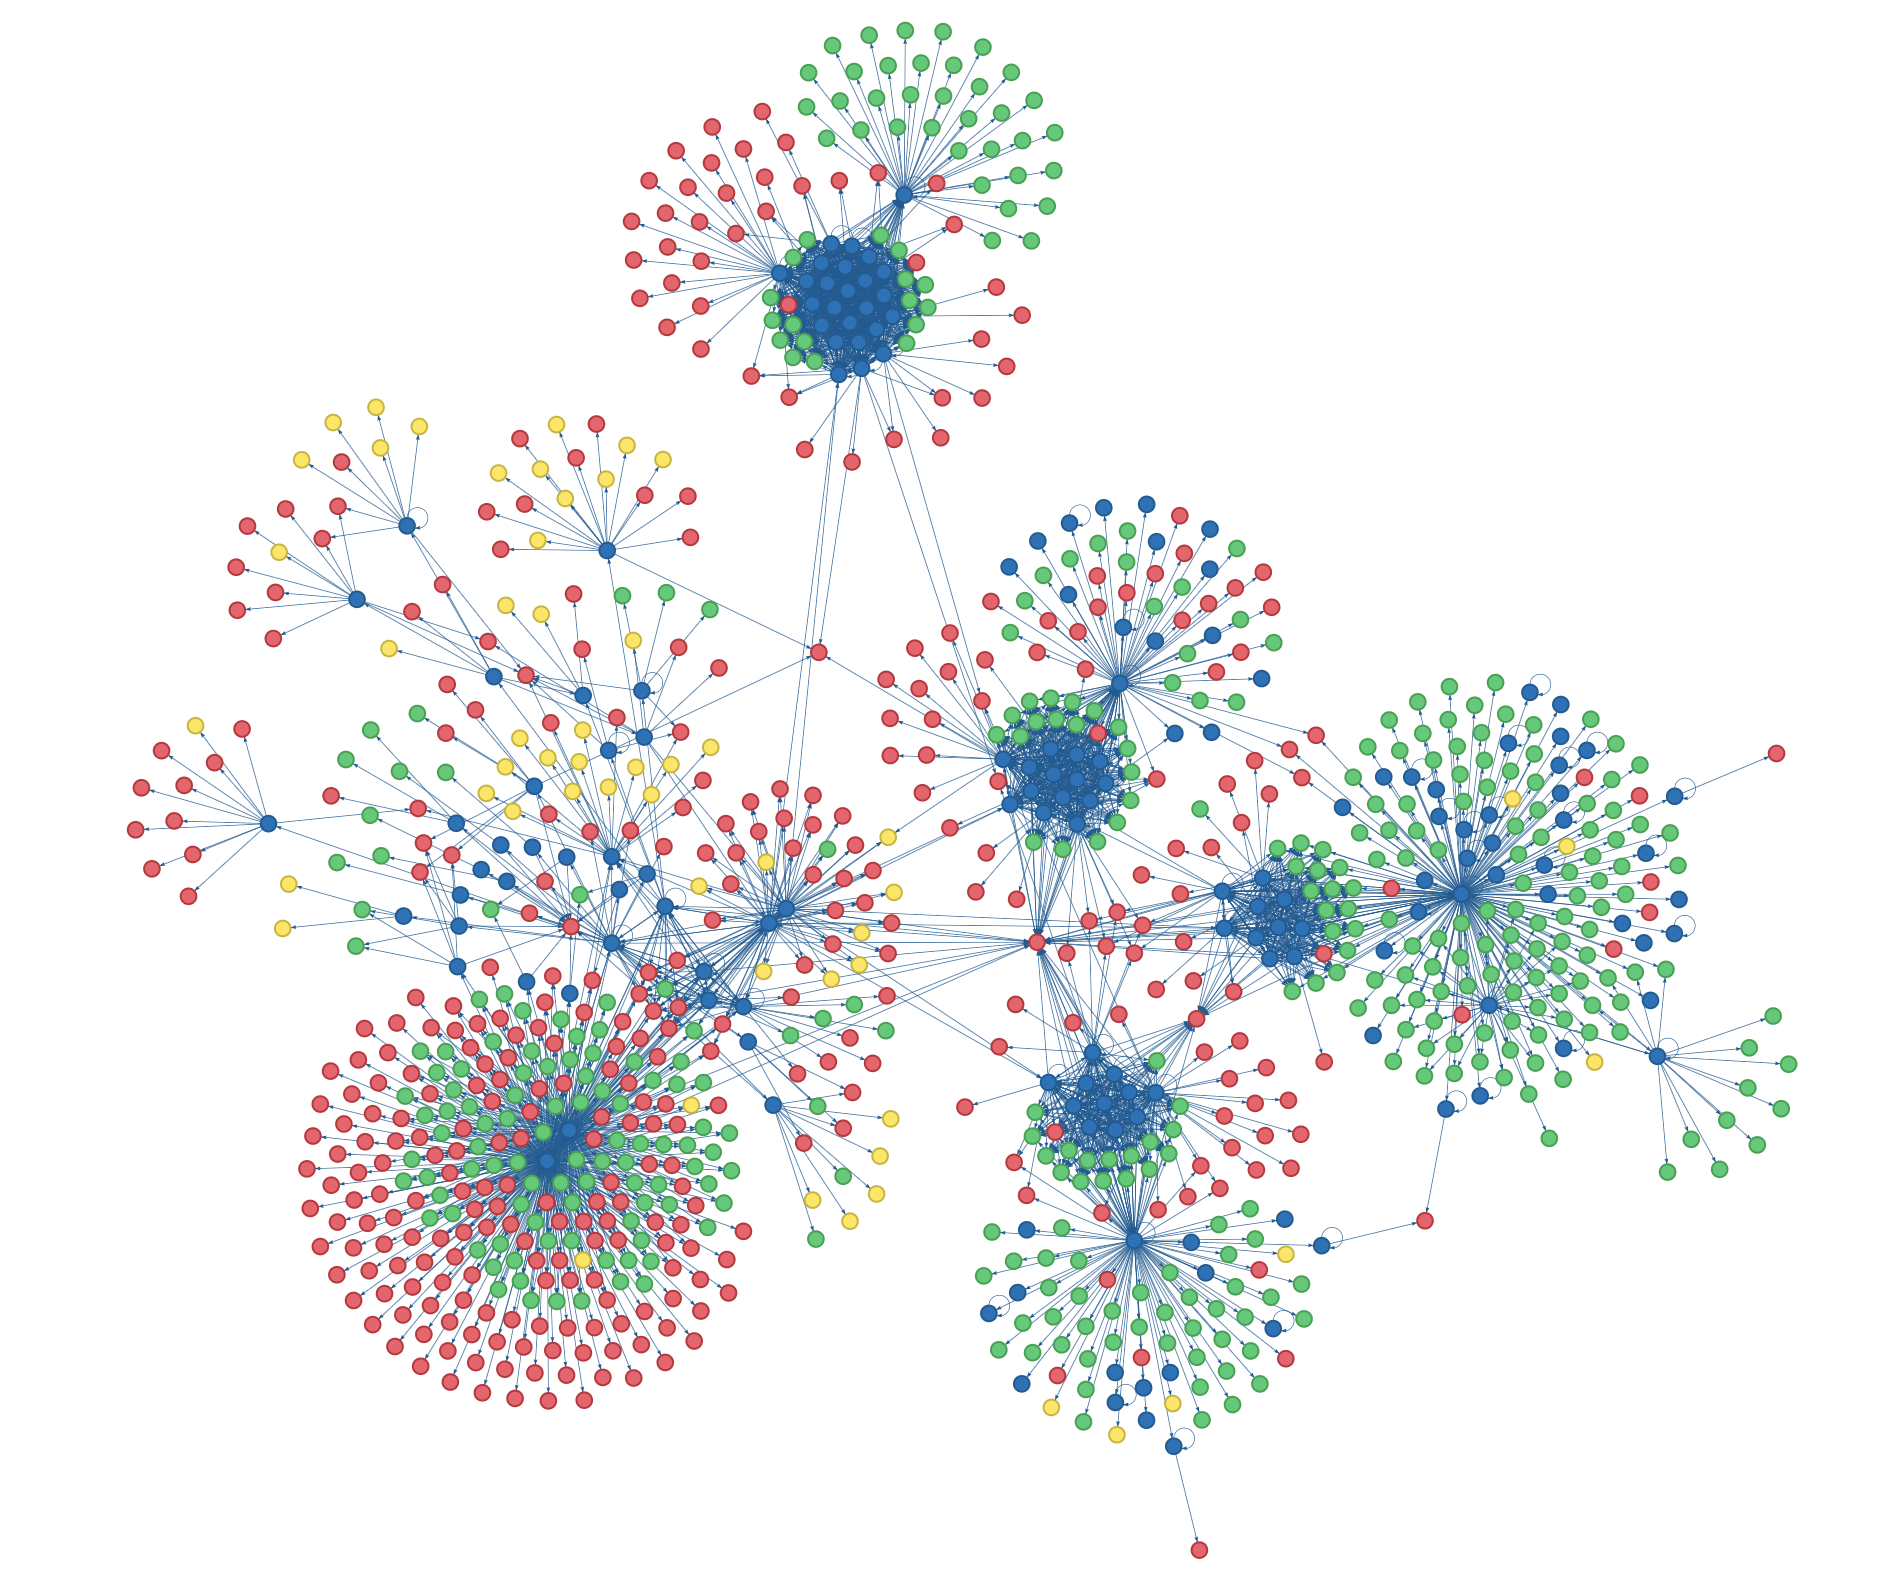
Each node is a page and edges represent links between pages. Blue nodes are internal HTML pages, green nodes are internal resources (anything not HTML, like PDFs), and red nodes are external pages. Any pages with errors would show up yellow (phew, none yet). Hover over a node to see its URL and try dragging nodes around to see the physics-based visualization. Fun fact, this page itself is in the graph. (Can you spot it?)
This visualization was made by a script I’ve been working on in my spare time, available at https://www.github.com/tomlinsonk/site-graph. In this post, I’ll outline how it works, how you can use it (and customize it) to visualize your own website, and the issues I ran into developing it (which hopefully are both interesting and useful to anyone else making a web crawler for the first time).
Here are some screenshots of other websites I’ve mapped.
Of course, there are existing tools for visualizing site graphs. Here’s an article that describes how to visualize websites with ScreamingFrog and Gephi. Sitebulb will probably do this too (and much more), but it’s a huge download and only has a 14-day free trial. WebSite Auditor can also make interactive site graphs, but again it’s a big proprietary tool. There are probably a million more. So why make yet another site visualization tool? Well, this script is small, easy to understand and run, open-source, hackable, and generates customizable and HTML-embeddable interactive visualizations. Plus it was fun to work on.
How it works
The idea is pretty simple: the crawler starts at the base URL of a site and performs a depth-first search of the site, following links to reach new pages. It only follows outgoing links from internal pages, as the goal is to map a single website (and its outgoing links to external sites). The main body of the script looks roughly like this (many details omitted).
def crawl(url):
    site_url = url
    visited = {url}
    edges = set()

    to_visit = stack()
    to_visit.push(url)

    while not to_visit.empty():
        url = to_visit.pop()

        page = # Fetch page

        for link in page:
            link_url = # Parse link URL
            edges.add((url, link_url))
            if link_url not in visited and link_url.startswith(site_url):
                to_visit.push(link_url)
                visited.add(url)

    return edges
The visualization uses a great library called pyvis, which in turn uses vis.js to draw and animate the graph. I’m using requests to fetch webpages and Beautiful Soup to parse them.
How to use it
Download the script from the GitHub page, install the required python packages listed on the GitHub readme, and (replacing the URL with yours) run
python3 site_graph.py https://www.cs.cornell.edu/~kt/
Make sure you use the full URL, including https://www. and a trailing slash (e.g. https://www.cs.cornell.edu/~kt/ ). If you don’t use https or omit the trailing slash, you’ll get warnings. You can override them with --force if you’re sure you want to. The larger the site, the longer the crawl will take (I wouldn’t run it on Wikipedia, for instance).
To see all available options, run
python3 site_graph.py -h
To change the visualization output file, use the --vis-file argument (by default, the visualization is saved in site.html):
python3 site_graph.py https://www.cs.cornell.edu/~kt/ --vis-file kt-site.html
To change the graph data file, use the --data-file argument (by default, this is saved in crawl.pickle):
python3 site_graph.py https://www.cs.cornell.edu/~kt/ --data-file kt-crawl.pickle
This data file is useful for customizing the visualization without performing a new crawl. See section below.
To change the dimensions of the saved visualization in pixels, use the --width and --height arguments (defaults are 1000, 800):
python3 site_graph.py https://www.cs.cornell.edu/~kt/ --width 1500 --height 1000
To also check links leaving the site for errors (e.g 404), use the --visit-external flag (this is slower).
The last three options, --show-buttons, --options, and --from-data-file are for tweaking the visualization and are described below.
Customizing the visualization
The default physics settings can make larger site graphs oscillate wildly. Plus, you may want to adjust the sizes of your nodes, whether the edges are curved, or a number of other settings. Luckily, pyvis makes it easy to adjust all of these things. To do this, first run the crawler with the --show-buttons flag:
python3 site_graph.py https://www.cs.cornell.edu/~kt/ --show-buttons
This will add a user interface to the visualization with which you can adjust every parameter. To make large graphs behave, I’ve found that reducing the gravitational constant helps (you can also try adding some overlap avoidance, increasing the spring length, adding damping, and reducing the maximum velocity). I’ve included a options.txt file in the repo that I’ve found works pretty well.
Once you’ve found settings you like, you can click the “generate options” button at the bottom of the page. Copy the generated text into a file, say my-options.txt, and then re-run the script with the --options argument to generate a visualization with no UI that uses the new options. To avoid performing another crawl, take advantage of the saved data file using the --from-data-file argument:
python3 site_graph.py --from-data-file crawl.pickle --options my-options.txt
If you want to change the node colors, you can modify the constants at the top of the site_graph.py script.
Challenges of web crawling
The core of the script is very straightforward, but the web is messy. Here are some of the things I had to deal with.
- Resolving links. Some links on a website are absolute (they contain the whole path of a webpage), while others are relative (they have a path relative to the current page). Easy enough to handle using
urljoin(base_url, link_url)from Python’surllib.parsemodule. That’s not enough, however: some pages specify a different base URL than their own using the HTML<base>tag. Moreover, the base tag itself often uses a path relative to the site’s root! So you really need to dourljoin(site_url, urljoin(base_url, link_url)). That was a strange one to debug; before fixing it, my crawler kept trying to reach nonexistent pages likewebsite.com/about/about/about/.../about/in an infinite loop. - Standardizing URLs. Even the same page may be referenced under several names. For instance, the links https://google.com, www.google.com, and www.google.com/ all bring you to the same site. To avoid having this create different nodes in the graph, I ask the page itself what it thinks its URL is. Before adding a URL to the
to_visitstack, I make aHEADrequest to the link URL usingrequests.head(url). This returns metadata about the page, including the final URL after any redirects. I can then use the URL returned by theHEADrequest as the canonical version of the link’s URL and translate future instances of the link URL into the canonical version. - Handling errors. Many things can go wrong when trying to fetch a webpage. The URL may not be pointing to a real location (a 404 error), the page may be password-protected (a 401 error), the server may have serious issues (a 500 error), or the connection may simply hang for one network reason or another. One important measure is to set a timeout, so that if a certain amount of time passes without hearing back from the server (I use 10 seconds), you can move on. The
requestslibrary handles this quite nicely withrequests.get(url, timeout=10).requests.get()also provides the HTTP status code and throws useful exceptions (likeTimeout) that I catch and handle. - Minimizing downloaded data. I designed this script for computer science academic sites, which tend to include PDFs of papers, large downloadable datasets, and other such bandwith-clogging (but valuable and important) artifacts. This is where the
HEADrequest comess in handy again. In addition to the pages’s resolved URL, it also returns the page’s MIME type, which indicates what type of thing the page is. I only add it to the stack (and thus ready it do be fully downloaded) if it’s an HTML page that could reveal more sweet, sweet links. - Query strings and fragment identifiers. URLs sometimes contain query strings, like https://www.google.com/search?q=query+string (everything after the
?), which pass parameters to the server. They can also point to subsections of a page using fragment identifiers, like https://en.wikipedia.org/wiki/Fragment_identifier#Examples (everything after the#). I decided to remove both of these from internal links, using moreurllib.parsemethods:urljoin(link_url, urlparse(link_url).path), but I keep them in external links.
Hope you find this amusing or perhaps even useful (e.g. for finding broken links). If you have any issues running the script or find bugs in it, either open up an issue on GitHub or send me an email. Happy crawling!
Kiran Tomlinson
PhD Candidate, Computer Science
I’m a Computer Science PhD candidate at Cornell University advised by Jon Kleinberg, researching social choice and preference learning.