Optical properties of calcite
Scattering Model
In order to develop a model for scattering we first have to understand how it works. The following figure depicts the different paths that light can take through a layer of impure calcite.
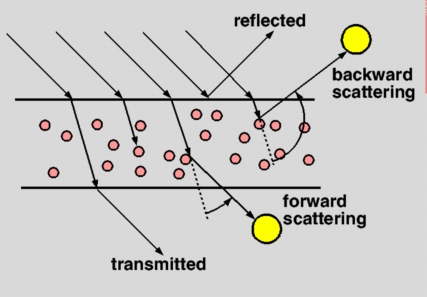
The light travelling through the crystal can be:
Forward scattering takes place when a light on the other side of the medium but not on the path of the transmitted ray get scattered and is therefore visible to the eye. Backward scattering occurs when light on the same side as the eye gets scattered by the medium and contributes to the visible light.
To capture these effects of scattering a simplified model of scattering was developed with the parameters below:
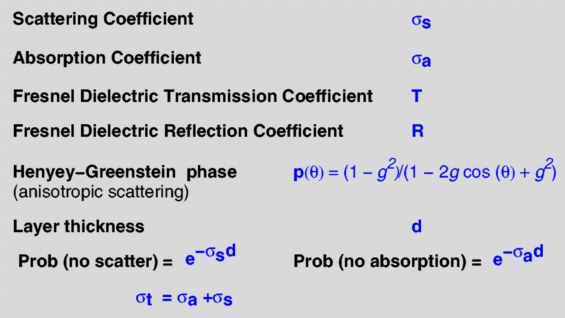
This model is similar to the one presented in the Hanrahan, Krueger paper except that it is simplified considerably and has terms that make intuitive sense.
The Henyey-Greenstein phase function is an empirical function to model anisotropic scattering. In our experiments, we used values of g that corresponded to large forward scattering. As the figure explains exp (-sigma_s d) is the probability that there is no scattering. Similarly, exp (-sigma_a d) is the probability that there is no absorption. Using similar arguments, we get the following picture:
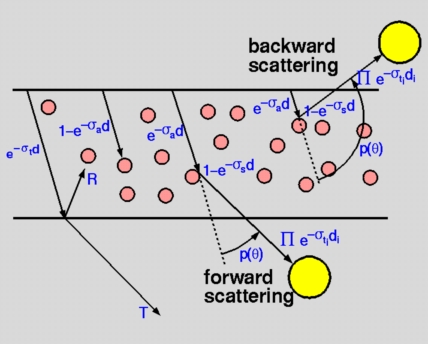
The weights along each path present the probability that the path is taken. These weights are used by the ray tracer to weigh the relative contribution of radiance along that path.
Layers
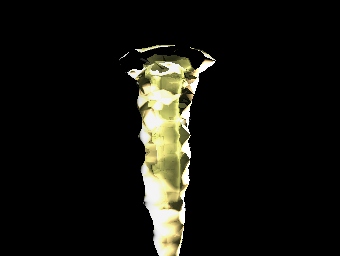
To use the subsurface scattering model, the concept of layers was added to the system. During the formation of stalagmites and stalactites snapshots of the geometry are taken and used as inner layers during rendering. These layers have material properties with their scattering and absorption coefficients set appropriately so as to model different impurities that are deposited over time in real stalactites and stalagmites. Each layer can have different properties to capture the effects of a mixture of different impurities deposited in the cave.For example the following image shows the two layers of a stalactite. This is not an actual rendering of the stalactite.
Modifications to the ray tracer
In order to render the complex geometry of speleothems several changes were made to ivray (ray tracer developed for the MIT graphics course 6.837).
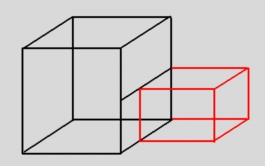
Hierarchical Space Partitioning
The geometry engine has thousands of polygons for each layer of the speleothem. Some hierarchical partitioning of these polygons is crucial for the rendering to be done in any reasonable time. Therefore, the ray tracer organizes objects into a hierarchical kd-tree. The ray tracer code to traverse the kd-tree using quadtrees was implemented by Kavita Bala for her research, and was used here. After building the kd-tree the ray tracer builds a quadtree adjacent to each kd-tree cell in the scene. Thus, when a ray intersects a cell, the ray tracer can very efficiently use the quadtree to figure out the next cell in the scene that should be visited.
Other optimizations were also added to the ray tracer. For
example, the notion of object space intersection was eliminated and
replaced by world space intersections. This works well when there are
a large collection of triangles in world space that need to be
considered for intersection.
Gaussian Normal Smoothing
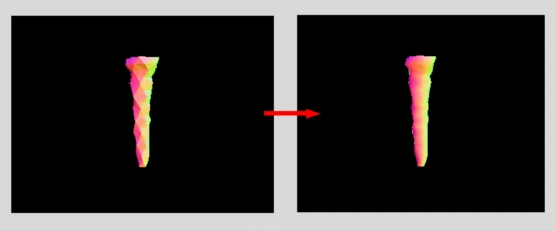
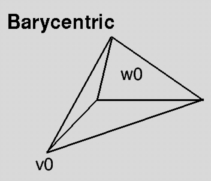
The output of the geometry engine is a large number of polygons. However, stalactites and stalagmites are smooth. Therefore, it was necessary to add normal smoothing to the ray tracer. This was done by applying a Gaussian filter to the normals of all polygons adjacent to a vertex to get the vertex's normal. The normals at each vertex of a polygon were then interpolated using Barycentric weights to get the normal for each point inside the polygon. The following color-coded image shows the normals for a stalactite. The LHS image shows the real normals of each polygon. The RHS image shows the normals after gaussian filtering and barycentric interpolation. The normals in the RHS are very smooth and achieve the properties we desire.
Level of Detail
Since the geometry engine can output a large number of very tiny polygons, it was necessary to add resampling to the system. We realized that our resampling could also be used to generate ouput at different levels of details. While we have not yet automated this process we would like to vary the LOD automatically based on the average distance of the central axis of the stalactite from the eye. This should be very easy to add to the system. Resampling is implemented by sampling uniformly about the central axis of the sodastraw.Results
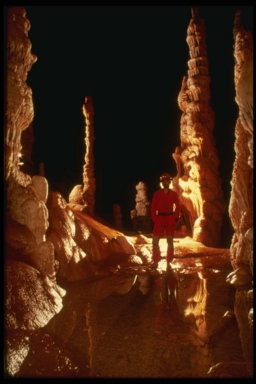
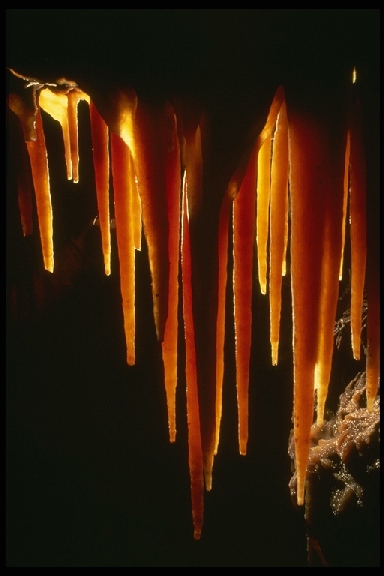
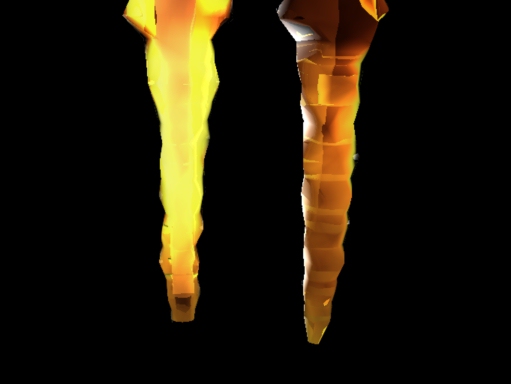
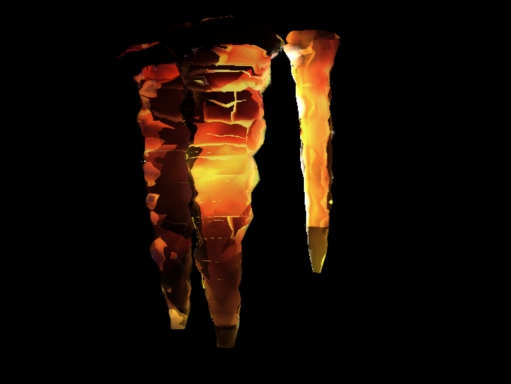
Using the modified ray tracer, the following pictures were generated. Each image took about 30-45 minutes to generate on a 250MHz MIPS R4400. The first two images depict rendered stalactites with strong backlighting. The bring out the effect of scattering in stalactites. In the first image, the LHS stalactite has a very intense light directly behind it. In this image, layering of the stalactites is also apparent.
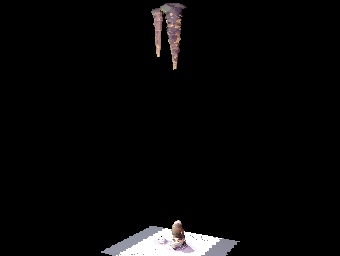
The following image shows stalactites and stalagmites in a scene without strong back lighting. This scene is rendered with 3 lights symmetrically distributed about the stalactite. The lights have small red, blue and green components respectively. As we can see the effects of scattering are not apparent when the stalactite is viewed from a distance.
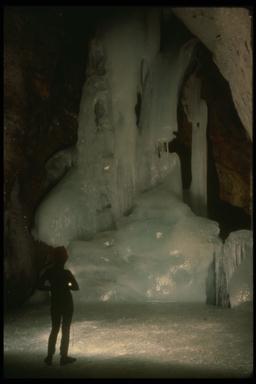
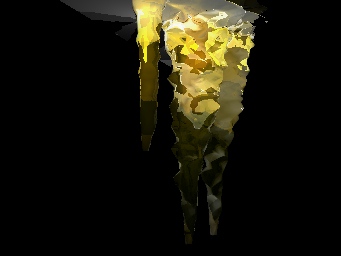
Getting the right coefficients for the scattering is important. In this image I show the effects of using the wrong coefficients. I used the coefficients of water in this scene and produced an image that looks very much like water. This makes us believe that this scattering model will be useful in rendering icicles.
Future Work
There are several areas in which we could extend this work:Conclusions
We have designed and implemented a model for the growth of stalactites and stalagmites. We have also designed and implemented a model for the scattering of light for multiple layers of particles. We have developed techniques to improve the performance of our ray tracer and have made rendering complex speleothems feasible. We have also presented results to demonstrate the effectiveness of our models.
Page maintained by: Kavita Bala (kb@graphics.cornell.edu)