Group 13 Abhijit Warkhedi Michael Gold Sanjeev Topiwala Anthony K. Yan
Java has gained wide interest due to its many attractive features. Java is highly portable due to it's Virtual Machine environment. It also has garbage collection, which alleviates one of the largest problems in C/C++, namely memory management. Java also has many tools for distributed computing, graphics, and networking which are built into the language itself.
Unfortunately, Java is slow. It is an interpreted language with garbage collection. As a result, Java is several to many times slower than C/C++. Writing efficient code, then, is critical in performance driven applications. A programmer will have several tools to help him achieve this goal, such as a good optimizing compiler, efficient algorithm design, and a code profiler. We choose to focus on a profiler.
A good profiler should perform two basic tasks: First, to indicate which parts of the code are CPU intensive, so that they may be targeted for optimization or modification. Second, the profiler should help the user to visualize the overall runtime behavior of the program. That is, help the programmer understand the run-time structure of the code which is CPU intensive.
We propose to implement a profiler that approaches these two tasks in the following
manner: We indicate CPU intensive code with traditional profiler information, such
as execution count and duration time for each block of code. To help reveal the
runtime structure of the program, we will display information from dynamic
clustering. Dynamic clustering will show the inter-connectivity of classes during
run-time.
Using visualization techniques, our profiler can display information about the number of times a code segment is executed (count), as well as the time spent in that segment (duration). We will have a GUI to interactively display the same information.
To the user visualize the run-time structure of his/her code, we perform what we call "dynamic clustering." That is, we apply clustering techniques on run-time information.
Traditional (or "static") clustering is based on the source code itself, not it's run-time behavior. It attempts, via counting function references, to deduce which functions are closely related. It then groups closely related functions together; it is a heuristic for discovering module structure.
In dynamic clustering, we are interested in which classes reference each other
frequently, at run-time. So dynamic clustering is based upon the number of function
calls during execution. Why would this be worth knowing? A profiler cannot
give a "deep" explanation for why a class is referenced often. (By
"referenced" we mean that its member functions are invoked.) However, it
can give a phenomenological explanation: a particular class is referenced often, because
it's methods are invoked by a cluster of classes which are very active.
Optimization, then, may involve severing the strong coupling between the class and its
run-time cluster, or by reducing the activity of the run-time cluster. Finally, the
user can observe how the dynamic clustering changes for different program inputs.
This may help determine how to optimize in situations where the program behavior changes
radically for different inputs.
Due to extremely tight schedule constraints (less than 18 days from the submission of
this proposal), we have divided our program into two parts: a core level of basic
functionality that will be implemented first. After the core is finished, we will
implement extended features, as time permits.
The profiler’s core features are as follows. The program will have a GUI interface to display profiling information at the class and function level. That is, statistics for number of function calls, total time spent, and average time spent in a function (or class) will be displayed. (See diagrams below.)
Clustering will apply a standard method, such as one discussed in CS501 lecture.
However, we will be performing dynamic clustering even though we are applying techniques
from static clustering. An example of clustering output is shown in a diagram
below. Naturally, we will allow the user to tweak various parameters of the
clustering formulae.
If time permits, we would like to add a few of the following advanced features.
First of all, we would like the profiler to work at a level more detailed than functions/classes. For example, a method may have a for-loop. It would be useful to know profiling information for the loop. If the method had several such loops, it might be desirable to know which loop was consuming the most time, or how much time the loop takes relative to the total time spent in the function.
Also, it would be useful to have information for the tree of function calls. A function might call other functions. We would like to be able to navigate the tree of function calls, and see statistics for each branch. For example, a function M might call functions A, B, and C. Statistics displayed could be the number of times M calls A, B, or C, and the total time spent in each of these functions. If the user clicks on, say, function B, then we can see which functions B calls, and the time spent in each of those functions, and so on.
Along these lines, we would like the profiler to provide more detailed timing information than just the overall number of calls and total (average) time spent in the function. For example, suppose A and B both call function F. It might be that A only calls F with parameters such that F executes very quickly. However, when B calls F, it passes parameters that make F run extremely slowly. This information would be hidden by an overall average (or total) for the time spent in function F. Therefore, we would like separate statistics for each invocation of F from each reference of F in the original source code.
Extended features of clustering might be ways to visualize clustering at several levels. ie: groups of clusters combine to form higher-level clusters. Also, we might cluster at the function level, rather than at the class level. That is to say, we cluster groups of functions together if they have a lot of interaction (even if they are from different classes). This is different than traditional clustering, which only groups classes together.
Finally, a shortcoming of the JDK profiler is it does not handle threads. It
would be desirable to extend our profiler to handle threads.
To help illustrate the features and GUI of our profiler, we consider a hypothetical example and show mock-ups of our program. Suppose we have a program which is a CPU intensive game, such as a typical first-person RPG. For example SAG without GUI. (We say without the GUI because typically the GUI will take lots of time, but it is not important to optimize.) Now as shown in the mock-up diagrams, we try to show the results of profiling and dynamic clustering.
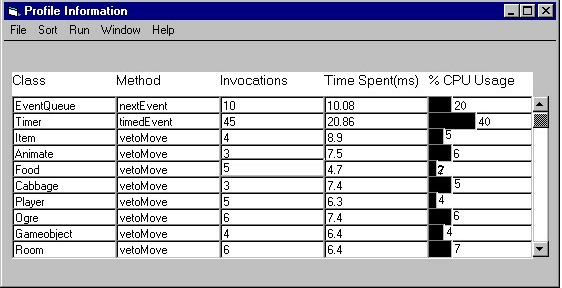
First we show diagrams of the profiler. We have profiling
information in tabular format, with entries for class name, method name, number of
invocations, time spent per invocation, etc. The table can be sorted by any of the
entries, so that the user may quickly find relevant information, such as which methods
consume the most (or least) time.
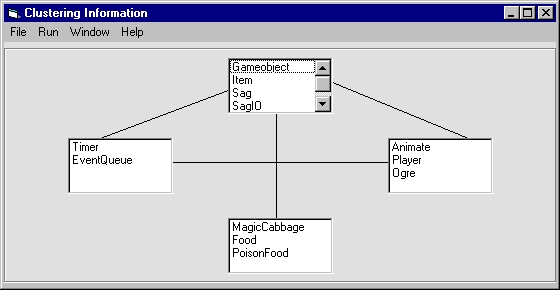
Next we demonstrate dynamic clustering. We follow the basic techniques for high-level system clustering which were presented in lecture. Each cluster typically consists of a number of classes which “talk” to each other a lot during run-time (tightly coupled). In our GUI, we have scrollable list boxes representing each cluster. The entries for each box represent the classes that comprise that class.
Our program will be in Java. However, Java is not truly platform independent. So we only guarantee compatibility with the following:
We would like our profiler to help the user accomplish two tasks: first to extract
basic profiling information such as execution count and duration, second to help the user
understand run-time program structure via dynamic clustering. However, we are under
tight scheduling constraints. So, we have a core set of features to be implemented,
and an extended set of features that will be implemented if there is time. Finally, we
note that testing the correlation (or lack of) between static clustering and dynamic
clustering may be a useful area of future research.