Javaizer User Manual
How is the Profile Data Generated
Although, this section is not necessary for using the program, it will provide greater insight into the results that the user is getting.
Profiling information is generated by instrumenting the source code, i.e. Javaizer simply inserts timing extraction code at the beginning and end of each function (and also at various other exit points such as return & throw). The profiler is prudent in most respects avoid reachability and other compiler specific problems. Once instrumented, the source code is executed causing it to generate a profile.dat file containing all the profiling information.
A crucial file, TimeRecorder.class is dynamically "linked" with the source
file to save the profile data. Javaizer tries to minimize the intrusive nature of the
entire profiling process by buffering the generated data and flushing the data to disk
only when the buffer is full or before the program exits.
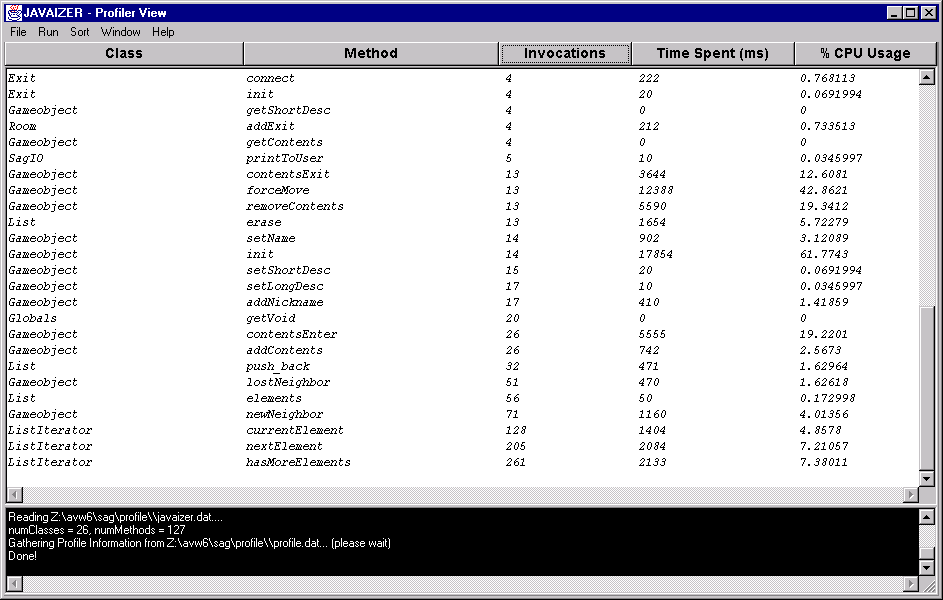
Interpreting profile results is pretty easy, but we have made it easier.
The table is designed to facilitate quick browsing of crucial information such as which
method is most time intensive, or which method was called most number of times and so on.
Here is a sample table that is created after generating profile data.
Class - class name
Method - method name
Invocations - number of times method is called.
Time Spent - total time spent in the method over all invocations.
CPU usage - percentage of the CPU time spent in the method normalized by main().
The above criteria should be quite sufficient to evaluate the performance of the your project.
(NOTE: times spent in the functions should not be used as absolute values since these are affected by the instrumentation of the source code. See instrumentation for more information on this.)
Suppose you are interested in locating which method has most CPU usage, all you need to do is click on CPU usage button. This will sort the table according to percentage of CPU usage in ascending order. Re-clicking the button, toggles it and sorts it in descending order. Same principle applies to all other criteria buttons.
Another option is to select various sort methods from the Sort Menu. This technique may be easier when one knows exactly which sort order is preferred.
Viewing Dynamic Class Clusters
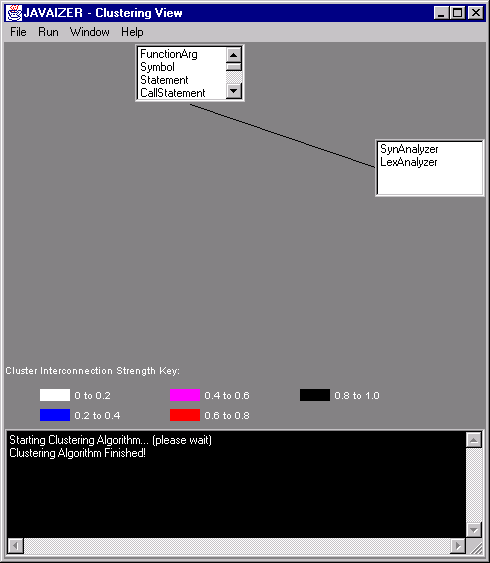
The strengths of the cluster interactions are color-coded. The strength value ranges
associated with different colors are display on the bottom of the clustering window in
form of a legend.
Interpreting Clustering Results
Interpreting clustering results is more difficult than profile results. Here, we provide few basic guidelines that will help you to understand and extrapolate the results. It was explained earlier that clustering information is dynamic in nature (see section on Viewing Clustering Results).
The clustering algorithm is quite complex. It is important to realize that there can be huge number of clustering possibilities growing exponentially as number of classes in the system. Javaizer incorporates some AI techniques to find optimal class distribution. However, the algorithm eventually reaches a local maxima causing it to prematurely select a cluster configuration as optimal. There can, however, be several local maximas, maximum of which is the truly correct and most optimal configuration. Searching for such a maxima is often an extremely time consuming due to the large number of possibilities.
The threshold value is configurable so that the user has more control over the clustering. By default, the threshold is chosen to be the "mean" (a bit more complicated that) of all class interactions. The quality of this "mean " depends on the distribution of the all class interactions. For instance, class A may interact 1000 times with class B and other classes in the program only interact few times. So, threshold is something that can be manipulated depending on the characteristic of the profiled program.
So what’s the bottom line? Good question! The bottom line is that clustering does NOT always provide an indication of the object-oriented design of the source code. However, it can be used to examine the run-time interactions between different classes in the program. For instance, you can answer questions like "which classes interact with each other a lot? [technical term - cohesion]" or "what is the degree of interaction between a group of classes (clusters)? [technical term - coupling]."
How does this help? Such information can aid the developer to gain insight into the interconnections of various classes and aid in re-design of the program.
(Important Note: Due to some degree of randomness in the clustering algorithm,
Javaizer may produce (hopefully slightly) different cluster configurations for the same
values of threshold and iterations.)
Working with Multiple Projects
The GUI provides functionality to easily and to efficiently work with multiple projects. Suppose, you are working with two projects and need to view profile information for both. First, you need to follow steps to generate profile data for both projects independently (procedure is outlined in Generating Profile Data section of the help). Once, the data has been generated, it you can load the profile information by choosing Load Profile Data from the File menu. The data is automatically display in form of the table. You can then switch to clustering window to view dynamic class clusters representing the run of the project.
Note, that this technique allows you to completely skip instrumentation and execution steps which can be time intensive. To look at another project’s profile results, you can do the same and all the information is retrieved and displayed.
It’s our hope that you don’t have to use this section often but anyway here it goes.
Please, look at the output (back background) window at the bottom of the screen. This provides all the information relating to the progress of the program. Any errors or problems will also be reported here. Take appropriate actions to fix your problems. Refer to below troubleshooting instructions to get more information on what error messages mean.
Programs with command-line arguments cannot be executed from GUI with any arguments. So, you have independently go to the destination directory and run jview on the instrumented code. A profile.dat file will be generated the same place. The GUI can then be used in a normal way to view profile results.
No, currently this feature is not supported.
Currently this feature is not supported. A workaround is re-structure your directory or profile individually.
If the program require files to be in its current or relative directory, you will have to copy/move them into appropriate locations since the profiled code is now in the destination directory.
Profile.dat format is invalid. The file may be corrupted, just re-execute your program and do show profile.
Javaizer does not let user generate profiling information in the same directory as the source in order to protect the original files from being overwritten. You must have specified source and destination path to be identical.
Source directory does not exist, or at least is not visible to the profiler.
This is obvious and does not require too much explanation. May want to check permissions.
Compiler path is specified in the options menu. Check if indeed the compiler exists at this location.
The compiler found some errors in the instrumented code. If thing you should check are the compiler error messages. If the messages have "unreachability" problems, this is due to extra VJ++ compiler checking. This version of the Javaizer has not taken all the step necessary to workaround this problem. What you can do is remove the instrumented lines that complain unreachability and proceed with normal sequence of operations. If no messages contain "unreachability" problems, then it’s your bug.
The destination directory did not exist initially. An attempt to create it failed. Possible reasons – permissions, a file already exists with the same name.
TimerRecorder.class is "linked" into the instrumented code to produce profiled output. Before doing so, it is copied to the destination directory. Check if the file is present in the Javaizer home directory.