Last week, I was at IISWC 2012 presenting WebChar, a system I built for automatically generating hypotheses about Web browser performance and energy consumption. The idea stems from the fact that, while browsers are the most-used apps on modern smartphones, they’re still slow and inefficient. Unlike desktop browsers, where page load times tend to be dominated by the network, mobile browsers spend excessive time and precious battery power just on rendering HTML and CSS—not to mention executing JavaScript.
But if a Web developer wants to write content that phones can render efficiently, they have little recourse. There’s plenty of expert advice on Web performance out there, but it’s overwhelmingly focused on techniques that address network time (e.g., minification or <script> tag placement). There’s comparatively little advice available about optimizing for rendering efficiency. And, since this advice comes from experts, it relies on human intuition and is slow to evolve—unlike, say, the rapidly shifting landscape of Web standards and browsers.
WebChar (for Web characterization) is a tool that aims to generate new browser performance advice automatically. It measures a large collection of real-world Web pages as they render on unmodified browsers. It then uses machine learning techniques to find page characteristics that tend to correlate with poor performance and high energy usage. This technique reveals new, unintuitive effects that can serve as best-practice advice for Web developers.
The WebChar Approach
WebChar’s workflow consists of four steps: data collection, browser measurement, model learning, and hypothesis mining.
First, WebChar downloads a collection of real-world Web content. In our experiments, we used the top 200 sites ranked by Alexa. We want to examine performance and energy in the context of common usage, so we need to avoid specializing to a single page—hence the aggregate analysis of a large dataset. We use an HTTP record-and-replay approach to capture all the resources associated with each page.
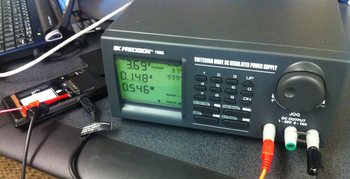
Next, WebChar measures the time and energy that a browser takes to render each page. We want to measure unmodified (perhaps even closed-source) browsers, so we use a special HTTP server that replays captured responses to the browser, which (using /etc/hosts trickery) directs all its requests to this server. To measure the energy consumed during page load, we removed the battery from a smartphone and connected it to an external power supply that periodically sampled the phone’s current draw. I wrote earlier about this power measurement setup.
Now that WebChar has a data set consisting of Web pages along with their performance and energy measurements, it trains a machine learning model based on this data (we use SVR). We actually create two distinct models: one relating page features to performance and one relating them to energy. In either case, the model approximates a function that, given a page’s features, predicts the page’s resource consumption.
Finally, WebChar mines the trained model to discover page characteristics that correlate with poor performance and energy efficiency. These correlations make up WebChar’s output hypotheses, verifiable assertions about what makes some pages slower and more energy-intensive than others. To Web content developers, each hypothesis represents potential advice for writing efficient pages; to browser developers, a hypothesis is a possible optimization target.
To get an idea of the sorts of hypotheses WebChar can uncover, we conducted a set of experiments and examined its findings.
A Few Unintuitive Findings
WebChar’s goal is to generate unintuitive and verifiable hypotheses about browser performance and energy. If it were to only generate obvious conclusions or artifacts of correlation but not causation, WebChar would not be very useful. And while our experiments did yield several known performance problems and one unverifiable hypothesis, they also generated several unintuitive but real effects.
Here are the conclusions we arrived at using one set of experiments running WebChar on two platforms: an Atom-based netbook and an ARM-based Android smartphone. We tested each unintuitive hypothesis using a pair of microbenchmarks—the tech report has more details on this evaluation technique.
- Laying out tables is expensive on the desktop browser.
- CSS opacity controls can be slow, especially on the mobile browser we measured: translucent elements rendered 28% more slowly than opaque elements in our mobile phone tests.
- On both platforms, “floating” elements are expensive. Since modern Web page layouts frequently depend on these elements for their structure, browser implementors should optimize for this common pattern.
- Background fills cost significant energy on Android. Even when pages do not seem to load slowly on that platform, they may spend a large amount of energy drawing backgrounds.
- The Android browser exhibits an inexplicable performance and energy penalty when using
<span>HTML elements. The developers should investigate this element’s unnecessary inefficiency.
While some of these effects make sense in retrospect, some of them are more surprising and none of them were previously well known. These six findings suggest that WebChar can help identify performance and energy problems that humans haven’t yet found.
Onward
While our initial experiments with WebChar yielded some interesting and useful results, I think there’s a lot more work do to here. For instance, we only examined two browsing platforms here and both were based on WebKit. We could learn more by comparing WebChar’s results on different browser engines, hardware platforms, operating systems, and so on.
Furthermore, one of WebChar’s selling points is that it’s fully automatic. It can crawl the Web, measure performance and energy, and generate new hypotheses—all without human intervention. So it would be possible to set up a machine to periodically obtain new data and new browser builds to provide up-to-date performance and energy information. As browser implementations, Web standards, and technology usage patterns shift, it would be incredibly useful to keep WebChar’s analysis current. A long-term deployment could also reveal trends as WebChar’s conclusions change over time
Finally, WebChar’s general approach—finding performance pathologies in complex, black-box systems—isn’t really specific to the Web. It bears investigating whether the same pattern can apply to other domains where performance is unpredictable.
There’s clearly at least one neat research project in here somewhere. So if you’re an undergrad at UW interested in this kind of thing (or know any), get in touch—let’s do some more research. Check out the code and data and read the tech report for more background.