
Example 1: What time is it?
Have you ever wondered how the analog clock is drawn on a computer screen or on some other kind of display for a digital device? In this example we’ll make only a still display, not a running clock! We will write a set of Matlab functions to display a time (e.g., 2:30:40) on a clock with hour and minute hands. First, let's see an example of the finished product:
>> timeClock(14,30,40)
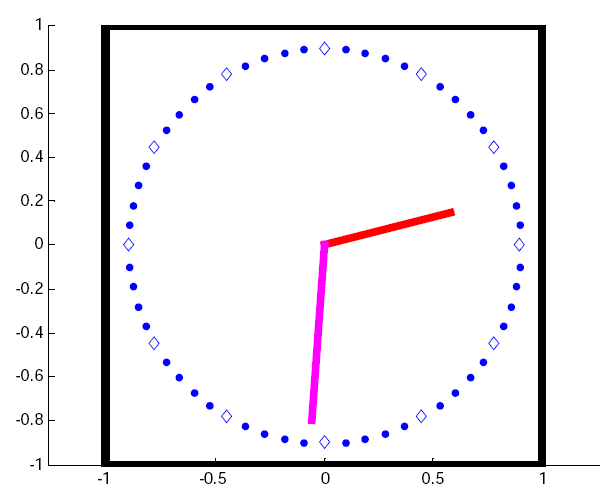
The clock is drawn in a figure window. Our clock's hands have a "continuous pivot," i.e., they are not restricted to the 60 individual minute marks. The hour value may be any integer in [0..24] and the minute and second values are in [0..59].
There are quite a few things that the solution will need: converting numeric time values to angles, converting angles to x-y coordinates for plotting, drawing the clock with tick marks, and of course drawing the hands to indicate the time correctly.
Instead of worrying about all these things at once, we decompose the problem in to several smaller sub-problems, Each sub-problem is a function that can be written and tested (mostly) independently. The three function headers and comment blocks are given below.
Our final goal is to write function timeClock:
function timeClock(h,m,s)
% Display the time h:m:s on a clock with hour and minute hands.
% Hour h may be in 12- or 24-hour clock format, i.e., range is [0..24].
% Minute m and second s are in the range [0..59].
Function timeClock is the main or "driver" function.
It carries out two major tasks:
- It draws the "stationary" components of the display, i.e., those parts of the display that do not depend on the time to be displayed, such as the clock frame and the hour and minute marks
- It draws the hands, whose orientation depends on the time
For this problem, it is convenient to think in polar coordinates
since hours, minutes, and seconds can be converted readily to
degrees. Recall that a polar coordinate has two components: radial and
angle (also called phase). The radial component is like the radius of
a circle; the angle is measured counter-clockwise from 0°, which
is the positive x-axis in the Cartesian system. For MATLAB's plot
function we use the Cartesian coordinate system, so we need a
conversion function polar2xy
function [x, y] = polar2xy(r,theta)
% (x,y) are the Cartesian coordinates of polar coordinates (r,theta).
% r is the radial coordinate and theta is the angle, also called phase.
% theta is in degrees.
Simple mathematics considerations lead to the following code implementation for this function
To keep the code of timeClock clean and tidy we
decided to encapsulate the first task above in a separate function,
which we have called drawClockFace This carries out the
following tasks:
- Setup a new graphics window centered at (0,0).
- Draw the square clock face, i.e., the outer black frame.
-
Draw 60 hour and minute marks at a given distance of the center of the
plot. Every fifth mark is an hour mark in which a
hourSymbolshould be placed
You can see the whole code for this function.
Finally, the drawing of the hands requires first computing angles for both the hour hand and the minute hand.
First, we compute total number of hours including the fraction coming
from the minutes and the seconds from the formula hours =
h + m/60 + s/3600.
Now, we need to come up with an angle correspinding to this number of
hours. Since angles in a polar coordinate system are measured
counter-clockwise from the x-axis, 12:00AM and 12:00PM correspond to
90° and every hour will add 360°/12 = 30° in the counter-
clockwise (i.e., negative) direction, the formula for the hour hand angle will be
hourAngle = 90 - hours*(360/12).
Similarly, the total number of minutes, including the fractiong coming from the seconds
is mins= m+ s/60 and the minute hand angle is
minsAngle= 90 - mins*(360/60)