Eye-Tracking Visualization
BOOM 2004
Project based on independent research (CIS 490) with Professor Geri Gay
OverviewVisual analysis is desirable in eye-tracking research because data sets are typically very large, with thousands of fixations that cannot be considered individually. However, due also to the high dimensionality of data sets, complete visualizations are impossible, and simple multi-dimensional scaling is not always practical or useful. For example, spatial dimensions, the x and y axes, are often crucial for computer-based eye-tracking, and their use already leaves only one dimension left for 3-D analysis. More creative, specialized applications for visual analysis are clearly the next step. This research will expand upon my existing 3-D visualizations to develop an application for spatial and temporal analysis of the various dimensions in a typical eye-tracking data set. More specifically, it will use animation and interactive design to connect different variables with key time and location variables, and to present localalized visualizations to reduce data.
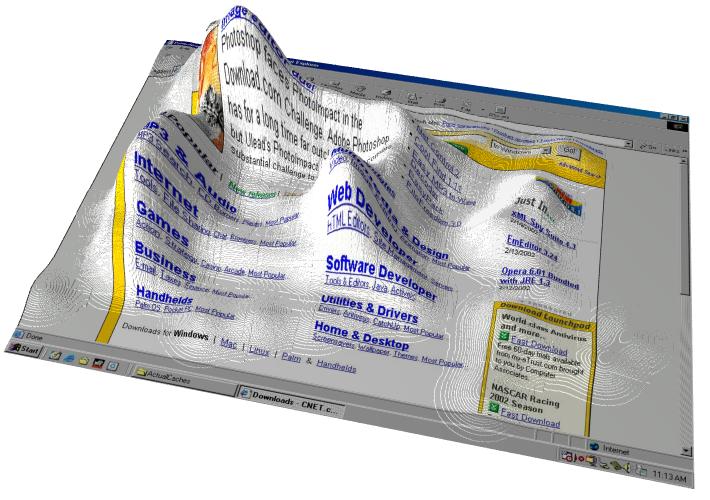
results of subjects tracked over CNet's front page
My existing Java code, based on David S. Wooding's "Eye movements of large populations: II. Deriving regions of interest, coverage, and similarity using fixation maps," creates a fixation map for rendering over the original image in the free POV-Ray ray-tracer. Since the ray-tracer code is freely available on the web, I plan on integrating it directly into my own program. This first step will allow for quick static and animated visualizations. I will also introduce individual scanpath plots onto the fixation maps, which will hopefully provide useful directional information.
For interactive visualizations, I plan on implementing a clustering algorithm such as k-means or agglomerative clustering in order to reduce the effective size of the data set, and also to identify locational "peaks" of fixations. Interactive elements of any visualization should update quickly, and clustering will help do so without immediately eliminating dimensions. My program will use mouse hovering or clicking for selectively exploring these extra dimensions over the spatial area.
In particular, hovering will allow local visualization of paths for both individual and aggregate Markov model analysis. I may also introduce an overlay for the expected or most representative path, based on the Viterbi algorithm for Hidden Markov Models and string-edit pairwise distances.
January
- Convert Java code to C/C++
February
- Make code accept standard GazeTracker output
- Integrate POV-Ray code (C++)
- Static images have scanpath trails
- Relate std. dev. of Gaussians on fixation maps to other measures
- Animate images with time
March
- BOOM 2004
- Use clustering to group related fixations
- Create interface for switching between different measures
- Create views for local Markov relations
- Finish coding, debugging
May
- Write up documentation, report
- 2/5/04 Code has been ported to C++, made this web page
- 2/10/04 Updated web page, submitted to BOOM
- 3/4/04 BOOM was great! Thanks for all of the stimulating conversations. My code almost has a Windows GUI and I'll try to post it here after I fix some bugs. I'll also post some images that include scanpath trails ("veins" of smaller bumps).
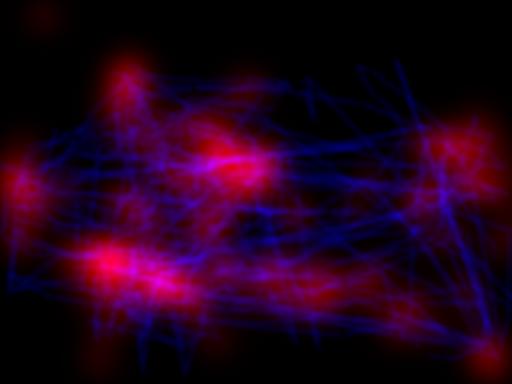 3/15/04 Scanpath "veins" didn't look very good in 3-d. I thought the noise ended up making the visual too hard to interpret. Putting the fixations and saccades in different colors, however, does present some interesting information about connections between clusters. Here (data from Amazon front page), fixations are in red and saccades are in blue.