CS 99
Summer 2002: Lab 1 Solutions 06.25
Task
1:
Use MATLAB to compute the expression sin(cos(ln25))+100(55/7-1000tan(.23))
ln is the symbol for natural log. Record the answer in a word document called LabOne.doc. Do this by highlighting the relevant lines in the MATLAB command
window with the mouse. Then click on 'Edit' on the menu bar and choose 'Copy.'
Now return to the word document and click on 'Edit' and choose 'Paste'. This
will paste the highlighted text from the Command window into your word document. Label
the pasted text in boldface as Task 1.
Solution.
>> sin(cos(log(25))) + 100*(55/7 - 1000*tan(.23))
ans =
-2.2629e+004
Task
2 (Optional)
Solve the system of
equations
x + y + z
= 16
x
+ y - z = -8
x
- y + z = 22
Copy the resulting answer in your word
document and label it Task 2.
Solution.
>> b = [16;-8;22];
>> x=A\b
x =
7
-3
12
Task 3:
Compare the results of typing help tangent and lookfor tangent in the Command window. Record the answers for each command in your word document and
label it Task 3.
Solution.
>> help tangent
tangent.m not found.
>> lookfor tangent
ACOT Inverse cotangent.
ACOTH Inverse hyperbolic cotangent.
ATAN Inverse tangent.
ATAN2 Four quadrant inverse tangent.
ATANH Inverse hyperbolic tangent.
COT Cotangent.
COTH Hyperbolic cotangent.
TAN Tangent.
TANH Hyperbolic tangent.
DTANSIG Hyperbolic tangent sigmoid transfer derivative function.
TANSIG Hyperbolic tangent sigmoid transfer function.
ACOT Symbolic inverse cotangent.
ACOTH Symbolic inverse hyperbolic cotangent.
ATAN Symbolic inverse tangent.
ATANH Symbolic inverse hyperbolic tangent.
COT Symbolic cotangent.
COTH Symbolic hyperbolic cotangent.
TAN Symbolic tangent function.
TANH Symbolic hyperbolic tangent.
BLKATAN This block defines an output angle that is the arctangent of two inputs.
BLKCOSATAN This block defines the cosine of an angle whose tangent is u1/u2.
BLKSINATAN This block defines the sine of an angle whose tangent is u1/u2.
Task 4 (Optional)
Find out how to plot multiple graphs in the same figure window using help plot. Use that information, and a careful study of the commands above, to find the
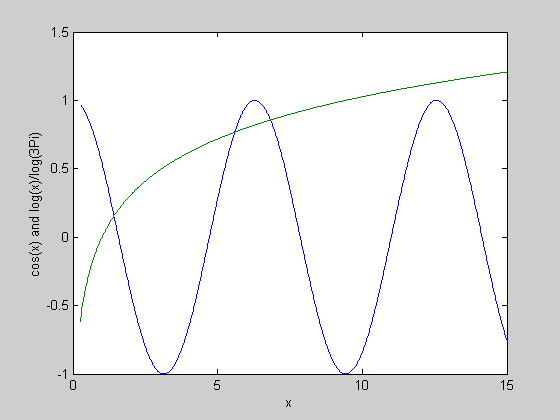
number of points of intersection of the graphs of y1(x) = cos(x) and y2(x) = log(x)/log(3p) in the range 0.25 ≤ x ≤ 15. In MATLAB, pi = 3.14159… Hint:
what would PLOT(X,Y1,X,Y2) do? Record your answer in LabOne.doc and label it Task 4.
Solution.
>> x = linspace(0.25, 15, 1000);
>> y1 = cos(x);
>> y2 = log(x)/log(3*pi);
>> plot(x, y1, x, y2);
>> xlabel('x');ylabel('cos(x) and log(x)/log(3Pi)');

The number of points of intersection is 3.