Generating traces from LLVM
Let's generate traces from LLVM!
The code described in this blog post is hosted here.
Overview
In this project we use LLVM to generate traces and execute them. We use LLVM passes to log all the traces in a program and use another pass to create an executable that only executes a selected trace. This could be useful to implement efficient trace selection, or to implement trace-based LLVM passes in general.
In a real system, an interpreter would internally implement both of these passes (profiling and trace generation). However, we did not use an interpreter due to technological limitations in LLVM.
Background
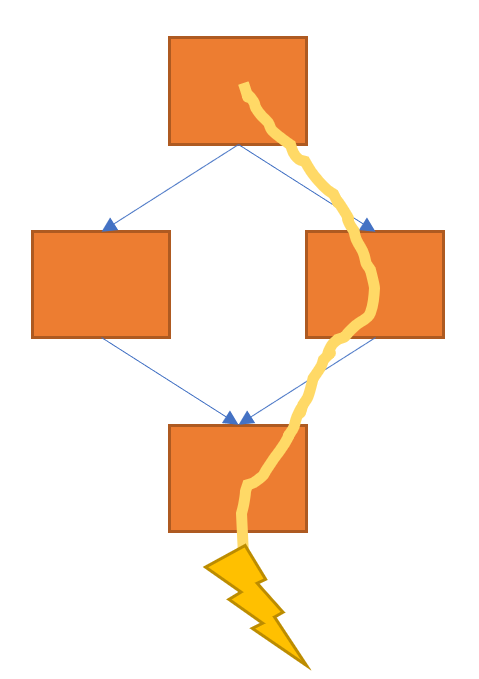
Trace-based compilers have found many use cases in computer systems. In tracing compilers, a loop body is compiled to only execute a single path (a trace) from the beginning of the loop body to the end. A trace, by definition, is a single basic block with the original branches removed. The reduction in branches can have a significant performance impact in many architectures.
Guards must be inserted to check whether this assumption of path taken by the program is correct. If it's not correct, then another path must be executed at high performance overhead. These systems speculate on a certain control flow of the program in a somewhat high-risk high-reward environment: the benefits of repeating the same trace is large (fewer instructions and more optimizations between basic blocks), but mispredicting the trace is worse than not running the trace at all.
Tracing systems found early success in VLIW architectures. These architectures try to schedule many instructions at once, but run into trouble scheduling across basic blocks, which may or may not be run. A single basic block can remedy this by only considering instructions along a single path through the program.
More recently, tracing has found success in Just-in-Time compilers (JITs) for dynamic languages. The most popular Python JIT is a tracing JIT that speculates on both types and control flow.
Trace Detection
To determine all the traces in a given program, we first use LLVM functions to detect branch instructions. We isolate branch instructions that diverge control flow and use an LLVM pass to insert a function call to a run-time library to log the condition upon divergence. At run time, when the conditions to the diverging branch instructions are resolved, the sequence of branch selections during execution is logged in a CSV file of boolean values. This sequence of branch selection forms a trace through the entire program taken during the profiled execution.
In order to trace loop bodies, we first need to identify where the loops are in the program. We attempted to this using an LLVM loop pass and trace within each individual loop. Unfortunately, we were not able to get this pass working. Instead, we manually extracted loops from programs and traced them in isolation from the rest of the original program.
Trace Generation
Traces through the program are generated using a function pass in LLVM. The pass takes as input the profiling data generated in the trace detection pass. The pass modifies a function by merging the entry block with other basic blocks along the function's path. At the end of the pass, the entry block will be the only block left in the entire function. We trace the program at the level of the function because it was simplest method. The applicability of this to real benchmarks will be discussed in the Evaluation section.
Starting from the top of the entry block, we traverse instructions in program order. We modify the entry basic block when we encounter one of four instructions enumerated below. Once this modification occurs, we restart the traversal from the beginning of the modified entry block.
| Case | Action to Entry Block | Instruction Action |
|---|---|---|
| Conditional Branch | Merge appropriate block (1 of 2) based on profile | Remove Branch |
| Unconditional Branch | Merge block jumped to. | Remove Branch |
| Function Call | Inline Function | Remove Call |
| Phi Node (only in -O1+) | Update program dependencies to last defined variable | Remove Phi Node |
Block merging transfers all of the instructions from a block into the entry block and removes the branch linking the blocks. Function inlining uses the built-in LLVM inline tool. Our algorithm is effectively recursive so control can be traced through branches nested in branches, functions in functions, branches in functions, etc.
We illustrate our pass with a simple test function shown below.
int example(int a, int b) {
  if (a > 3) {
    return a + b;
  }
  else {
    return a - b;
  }
}
The following multi-block LLVM IR is created at -O0.
define dso_local i32 @example(i32, i32) #0 {
  %3 = alloca i32, align 4
  %4 = alloca i32, align 4
  %5 = alloca i32, align 4
  store i32 %0, i32* %4, align 4
  store i32 %1, i32* %5, align 4
  %6 = load i32, i32* %4, align 4
  %7 = icmp sgt i32 %6, 3
  br i1 %7, label %8, label %12

8:                                                ; preds = %2
  %9 = load i32, i32* %4, align 4
  %10 = load i32, i32* %5, align 4
  %11 = add nsw i32 %9, %10
  store i32 %11, i32* %3, align 4
  br label %16

12:                                               ; preds = %2
  %13 = load i32, i32* %4, align 4
  %14 = load i32, i32* %5, align 4
  %15 = sub nsw i32 %13, %14
  store i32 %15, i32* %3, align 4
  br label %16

16:                                               ; preds = %12, %8
  %17 = load i32, i32* %3, align 4
  ret i32 %17
}
After applying the trace generation pass (speculating block %8 is taken), we produce the following LLVM IR.
define dso_local i32 @example(i32, i32) #0 {
  %3 = alloca i32, align 4
  %4 = alloca i32, align 4
  %5 = alloca i32, align 4
  store i32 %0, i32* %4, align 4
  store i32 %1, i32* %5, align 4
  %6 = load i32, i32* %4, align 4
  %7 = icmp sgt i32 %6, 3
  %8 = load i32, i32* %4, align 4
  %9 = load i32, i32* %5, align 4
  %10 = add nsw i32 %8, %9
  store i32 %10, i32* %3, align 4
  %11 = load i32, i32* %3, align 4
  ret i32 %11
}
Phi Nodes should also be removed because there is no control flow to merge in the trace after block merging has occurred. When a Phi Node is removed, the single operand that exists should be forwarded to the uses of that Phi Node.
We do not remove the basic blocks during the previously described traversal. It's possible a block that was not taken by a conditional branch may be jumped to later, so we can't delete it. Once block merging and inlining is complete, we delete all dead basic blocks by checking if any predecessors exist.
The traces generated take the place of the given function. They do not contain guards that check if the path speculation was correct. Thus they must be run in isolation as a single loop iteration.
Evaluation
We evaluate on a subset of benchmarks from Embench. These are single-threaded benchmarks targeted at embedded systems.
We do not have an interpreter or language run time so we could not inject trace code into the program, and importantly handle failed traces. Additionally, there are no guards to hook into this language run time even if it did exist. For these reasons, we do not evaluate on entire programs, but rather small sections of the programs. Our methodology is a shown below.
| Step | |
|---|---|
| 1 | Manually extract the body of a "hot" loop into a function |
| 2 | Compile the function and run with the profiling pass |
| 3 | Compile the function with the trace generation pass |
| 4 | Run the generated trace |
In certain scenarios, we removed some loops (set the iterators to their initial values) and unrolled fixed size loops when possible.
We evaluate on small code sections from four Embench benchmarks and one synthetic benchmark. The features of each code section are described below.
| Benchmark | Conditional Branches | Function Calls |
|---|---|---|
| minver | 2 | 1 |
| aha-mont64 | 1 | 0 |
| nbody | 0 | 1 (built-in, don't inline) |
| ud | 1 | 0 |
| synthetic | 2 (nested) | 0 |
Our performance metric is the number of machine instructions generated by the optimized program vs. the un-optimized program in the observed function. We use objdump -dC <binary> and count the number of instructions in the function. We compiled both at -O0, but included a dead code elimination (--dce) pass after both to eliminate no longer useful instructions from the trace (condition check and initializing un-used variables).
| Benchmark | Un-opt Machine Inst. | Opt Machine Inst. | Inst. Reduction (%) |
|---|---|---|---|
| minver | 64 | 33 | 48 |
| aha-mont64 | 45 | 34 | 24 |
| nbody | 130 | 130 | 0 |
| ud | 56 | 50 | 11 |
| synthetic | 39 | 12 | 69 |
We see a reduction in the number of instructions generated for all programs with branches and inline-able functions.
We also executed the traces as standalone functions to check correctness. For each benchmark, we compared the output of a single loop iteration of the original loop and compared it the output of the trace for the same input. In all case, the result was equivalent between the original loop and trace.