Runtime Execution Profiling using LLVM
Goal
The goal of the project is to collect run-time information by adding an LLVM pass that is accurate even in multi-threading program. We are interested in three kinds of information:
- Basic execution information including the number of LLVM instructions, basic blocks etc.
- Expensive instruction information like the number of memory operations, multiplications and branches since they are most likely to affect execution time.
- Function call information: the number of times each function is called.
Design Overview
The LLVM architecture looks like this:
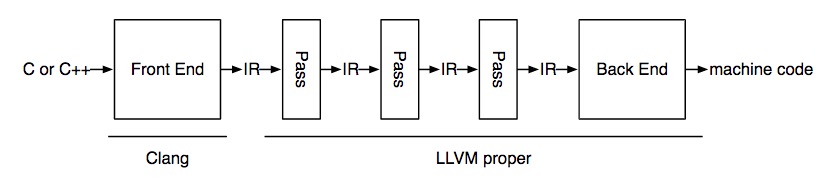
"IR" stands for intermediate language. We only need to add one pass that changes the existing IR program to another IR program (program which includes the desired properties like profiling information), following instructions to add an LLVM pass in our instructor, Adrian's blog post. We also took help from the Github repo atomicCounter where the increments to the atomic global counter variables are atomic updates. In our project, we don't profile atomic operations but use atomic updates to global variables.
We start from ModulePass and then access functions inside a Module, BasicBlocks per function and instructions per BasicBlock to obtain all information. At the beginning and ending of each module, we also call a custom method initialize to create global variables in IR and finalize to print global variables. The structure of our profiling pass looks like this:
  struct SkeletonPass : public ModulePass {
    static char ID;
    SkeletonPass() : ModulePass(ID) {}

    virtual bool runOnModule(Module &M); //when there is a Module
    virtual bool runOnFunction(Function &F, Module &M); //called by runOnModule
    virtual bool runOnBasicBlock(BasicBlock &BB, Module &M); // called by runOnFunction

    bool initialize(Module &M); //create global variable
    bool finialize(Module &M); //print global variable

    void createInstr(BasicBlock &bb, Constant *counter_ptr, int num);

    vector<string> atomicCounter; //keep global variable names for profiling. e.g. instr counter
  };
Implementation
Basic Execution Information
In the initialize method, we create global variable llvmInstrAtomicCounter and basicBlockAtomicCounter with GlobalVariable constructor.
new GlobalVariable(M, I64Ty, false, GlobalValue::CommonLinkage, ConstantInt::get(I64Ty, 0), atomicCounter[i]);
Then in runOnBasicBlock, we obtain a pointer to the global variable names with getOrInsertGlobal method. After getting the instruction number in each block, we create atomic addition with AtomicRMWInst constructor.
Finally, in the finalize method, we print the profiling results with global variable names and the corresponding values at the end of main block before return:
- We create
printfFunctionCallee withgetOrInsertFunction) method. - We insert
CreateGlobalStringPtrmethod to create pointer pointing to string we would like print. - Then we obtained the value of corresponding strings with the
loadInstmethod. - The last step is to create the function call with
Create.
The complete code is post in Neil's Github repo.
Expensive Operations Information
This part follows the same flow as basic execution information except we need to distinguish the instruction type and increment corresponding counter on a block basis. Therefore in each runOnBasicBlock method, we need the following lines:
for (auto it = bb.begin(); it != bb.end(); it++) {
	switch (it->getOpcode()) {
        case Instruction::Mul:// multiplication
            mul_instr++;
            continue;
        case Instruction::Br:// branch
            br_instr++;
            continue;
        case Instruction::Store:// store
        case Instruction::Load:// load
            mem_instr++;
            continue;
        default:
            break;
    }
}
Function calls
We profile the number of times each function was called in the program. This is done by first initializing global variables corresponding to all the functions in the program to zero. This is done statically by iterating over a function list in the module given by getFunctionList(). This returns all the functions called in the program including the ones that were included from C libraries like printf or scanf.
auto &functionList = M.getFunctionList(); // gets the list of functions
for (auto &function : functionList) { //iterates over the list
    Value *atomic_counter = new GlobalVariable(M, I64Ty, false, GlobalValue::CommonLinkage, ConstantInt::get(I64Ty, 0),  function.getName()+".glob"); // create a global variable, name it based on the function name
}
Next we want to insert atomic counters at the start of each function definition. This ensures that irrespective of multiple return points in the function we can always increment the counter for it at the beginning. We start with the entry basic block in the function which is given by the iterator F.begin(). To insert it at the top of the basic block we use getFirstNonPHI() which returns the first instruction that is not a PHI node. We insert an atomic add instruction similar to other profiling instructions.
Hardest Parts
- For people who are new to LLVM, instructions are hard to find and follow. Searching on Google can help if you know what you're looking for. It's difficult to get helpful information unless your search is confined to existing functions. Even though LLVM documentation is pretty exhaustive, it has too many functions to go through and the lack of examples can be off putting. Tutorials and existing backbone codes on Github can be really handy in these scenarios, which we took advantage of. It not only helped us implement specific functions like
printfbut also establish a structure to our IR pass. - String manipulations: I am not sure if this is the right term to use, but LLVM seems to have 2 string types - Twine and StringRef.
getNameon a function returns a StringRef. In order to make a custom name I performF.getName()+"name"which returns a Twine. But the functiongetGlobalVariableonly accepts StringRef. Twine has a functionstrwhich can be used to convert it into string. Even though this is a straightforward solution, it ended up taking time to figure out the problem and looking into the documentation of these classes. - Setting up and running benchmarks: "It's all fun and games until you run your IR pass on real programs" - anonymous. We faced issues setting up benchmarks like PARSEC on Mac. Embench had multiple source files to compile which ran into trouble partly due to our IR pass not being thoughtfully written. We were defining global variables in all the files irrespective of it being a function/utility file or the main source file. We ended up using Phoenix which worked well on Linux but was not meant for Mac. Hence for doing our LLVM pass, we had to install and update libraries on Linux machines.
Evaluation and results
Gcov profiling tool
To validate and benchmark our profiling results, we use gcov testing tool which can be used as a profiler to give performance statistics. We first compile the code using gcc flags required for gcov : gcc -fprofile-arcs -ftest-coverage foo.c . Now we run gcov with relevant flags to give us statistics to compare with our profiler:
gcov -b -c -f foo.c
We ran the Phoenix benchmark suite and used gcov to profile statistics of function calls. The makefile initially had optimization flag -O3 but this might lead to incorrect numbers of function calls due to optimizations, so we compile without any flags. We picked Kmeans arbitrarily to demonstrate a detailed example of our profiling tool below:
Kmeans
Sequential execution without optimization flags yields the following output for function calls by gcov:
main: 1
dump_matrix: 1
calc_means: 23
find_clusters: 23
add_to_sum: 23000
get_sq_dist: 230000
generate_points: 2
parse_args: 1
We only list the function calls from the profiling tool gcov for sanity check. Our profiling pass also outputs other instruction statistics. The output generated by our profiling pass is listed down below:
llvmInstrAtomicCounter: 40091156
basicBlockAtomicCounter: 5019598
mulAtomicCounter: 691267
memOpAtomicCounter: 20250888
branchAtomicCounter: 4766547

parse_args: 1
generate_points: 2
add_to_sum: 23000
find_clusters: 23
get_sq_dist: 230000
calc_means: 23
dump_matrix: 1
main: 1
The numbers match with gcov. We compile the results for all benchmarks below.
Results
The following results are for sequential execution of the benchmarks. We have reported the instruction counts in the following table:
| Benchmark | LLVM instruction count | basic block count | multiplication count | memory operation count | branch operation count |
|---|---|---|---|---|---|
| Histogram | 1707337893 | 104532503 | 0 | 871090234 | 104532501 |
| Kmeans | 40091156 | 5019598 | 691267 | 20250888 | 4766547 |
| Linear regression | 2244735757 | 86335992 | 86335983 | 1093589204 | 86335991 |
| PCA | 35388 | 3461 | 573 | 17975 | 3454 |
| String match | 3652012341 | 454936402 | 0 | 1575281754 | 443891533 |
| Word Count | 1148215642 | 213577613 | 46026 | 512924102 | 199431461 |
Function counts for the benchmarks are listed below (they have been matched with gcovs output as well):
Histogram:
test_endianess: 1
main: 1
Kmeans:
parse_args: 1
generate_points: 2
add_to_sum: 23000
find_clusters: 23
get_sq_dist: 230000
calc_means: 23
dump_matrix: 1
main: 1
Linear Regression:
main: 1
PCA:
parse_args: 1
dump_points: 2
generate_points: 1
calc_mean: 8
calc_cov: 8
main: 1
String match:
getnextline: 5522432
compute_hashes: 5522435
string_match: 1
main: 1
Word Count:
wordcount_cmp: 579521
wordcount_splitter: 1
wordcount_getword: 1
wordcount_addword: 1513425
dobsearch: 1513425
main: 1
Pthread execution
We also ran kmeans using pthreads on 8 threads. We can see that some of the function calls in the output are scaled by 8 in both gcov and our profiling pass. Matching results also show that atomic counters were successfully implemented.
gcov output:
main: 1
calc_means: 184
find_clusters: 184
add_to_sum: 23000
get_sq_dist: 230000
generate_points: 2
parse_args: 1
dump_points: 1
Our profiling output:
llvmInstrAtomicCounter: 40125466
basicBlockAtomicCounter: 5023832
mulAtomicCounter: 691429
memOpAtomicCounter: 20266988
branchAtomicCounter: 4770459

dump_points: 1
parse_args: 1
generate_points: 2
add_to_sum: 23000
find_clusters: 184
get_sq_dist: 230000
calc_means: 184
main: 1