CS 4414/5416:
Systems Programming
Profiling and Code Optimization
2026-09-17
Logistics
Reminder: Class sheets and PollEverywhere
- Switching from class sheets to
- Poll Everywhere for attendance + in-class
- Ed threads for longer feedback
- Thanks for engaging with this!
Upcoming
- Lab 4 (Fri): Get you set up to profile code on GCE!
- Submission will be via Gradescope (by group)
- P2 check-in (Mon): Blocking transformation
- Prelim (Tue): Rust
Prelim Logistics
- Notes sheet: One sheet, both sides, handwritten
- No larger than 8.5-by-11 or A4
- You may print iPad notes, but your handwriting (no shrinking)
- Practice exam
- Practice exam should be up now
- Consolidated exercises and answers by Sat PM
- Review session: TBD
- Ed questions are always open!
Recap
Where We Are
This module: fundamentals of single-thread performance
- Hardware effects (particularly memory)
- Performance modeling and measurement
- Using the compiler and tools effectively
Concurrency and multi-threaded performance comes later.
Tue: Instruction-Level Parallelism
Single core exhibits lots of ILP
- Many different components
- Wide instruction fetch
- Out-of-order execution engine
- Pipelined functional units
- SIMD (vector) instructions
- Your goal: obvious independent work in a local segment
- Compiler can help you from there
Tue: Memory Matters
GB of memory, access (esp latency) is not uniform!
- Many levels of cache; lowest (L1) is usually 32-128 KB
- Tuned for spatial and temporal locality
- Spatial: organization in lines (also, prefetch engine)
- Temporal: LRU replacement policy, keep working set
- Misses (compulsary, capacity, confict) cost many cycles
- Favor compact data, limit working sets, regular access
Poll Everywhere!
Does this code benefit from
- Spatial locality?
- Temporal locality?
- Both?
- Neither?
Respond at: https://PollEv.com/davidbindel252
or send davidbindel252 to 22333
(Trans)portable Performance
- Details have orders-of-magnitude impacts
- But systems differ in micro-arch, caches, etc
- Want transportable performance across HW
- Need principles for high-perf code (+ tricks)
Principles
- Think before you write (today)
- Stand on shoulders of giants (today)
- Time before you tune (today)
- Tune your data structures (next Tue)
- Help your tools help you (next Tue/Thu)
A Practical Example
My Favorite Example
GEMM: \(C = C + AB\) or
\[c_{ij} = \sum_{k=1}^n a_{ik} b_{kj}\]
- Central to many computations
- Complexity is \(O(n^3)\) for \(n\)-by-\(n\) matrices
- Data is \(O(n^2)\)
Can make this blazingly fast! And would, in an HPC class.
Fast Mean Edit Distances
P2: Mean Hamming distances in a dictionary
- \(d(s_i, s_j)\) is swaps to convert \(s_i\) to \(s_j\).
- Goal: \(\bar{d}_i = N^{-1} \sum_{j=1}^N d(s_i, s_j)\)
- \(O(N^2)\) computation on \(O(N)\) data
Algorithm notes:
- Don’t know an \(o(N^2)\) approach to this problem
- Can shave constant factors via symmetry
Design Space
Can change: dist code, comparison orders, data structures, …
Some Observations
- Larger dictionary will not fit in L1 cache
- Inner loop over all words will see L1 misses
- For English dictionary, maybe not L2 misses
- Lookup in a
VecofStrings requires two indirections- Offset from start of vector
- Look up string in memory
- Inner loop
distis not currently tuned!
How Fast Can We Get?
- Memory improvements
- Blocking for cache locality
- Limit pointer chasing
- Maybe compress data?
- Computation improvements
- ILP in distance computation (and smaller types?)
- Maybe improve distance algorithm?
- Maybe exploit symmetry?
Programmatic Note
- We will largely discuss ideas that apply across languages
- See Rust Performance Book for more Rusty details
Ask Me a Question!
Think Before You Write
Premature Optimization
We should forget about small efficiencies, say 97% of the time: premature optimization is the root of all evil.
… Yet we should not pass up our opportunities in that critical 3%.
- Knuth, Structured programming with go to statements, Computing Surveys (4), 1974.
Premature Optimization
- At design time, think big efficiencies
- Don’t forget the 3%!
- And the time is not premature forever!
Functionality First
- No prize for fast wrong answers.
- If you must tune, have good tests!
- And run them. Often.
Lay-of-the-Land Thinking
- What are the “big computations” in my code?
- Think asymptotic complexity, constants, and \(n\)
- Has someone else written a tuned code?
- The best new code is no code!
Lay-of-the-Land Thinking
If you think you might tune:
- What are natural algorithmic variants?
- Vary loop orders? Different interpretations!
- Lower complexity algorithm (Strassen?)
- Should I rule out some options in advance?
- How can I code so it is easy to experiment?
Don’t Sweat the Small Stuff
- Your time costs more than computer time!
- Fine to have high-level logic in Python and company
- Probably fine not to tune configuration file readers
- Maybe OK not to tune \(O(n^2)\) prelude to \(O(n^3)\) algorithm?
- Depending on \(n\) and on the constants!
Do More with Less (Data)
Want lots of work relative to data loads:
- Keep data compact to fit in cache
- Short data types for better vectorization
- But be aware of tradeoffs!
Consider Hamming
- Have \(O(N)\) reads and writes and \(O(N^2)\) work
- Good operational intensity: work / memory op
- Taking \(O(N)\) time to prepare data is a good choice
- Probably spending more time on I/O than prep!
- Expensive part should be all the \(d(s_i, s_j)\)
- Can compute \(d(s_i, s_j)\) in any order…
Blocking
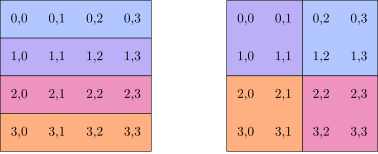
Blocking
- What if we consider blocks of \(B\) at a time?
- Can choose \(B\) small enough to fit L1 cache
- Takes \(O(B)\) loads to warm the cache
- Perform \(O(B^2)\) work on the data
- Probably should make \(B\) a
constparameter - May be useful to look at
chunkiterator - Makes a difference (though our dictionary fits in L2)
A Question for You
Accounting for the string data and metadata, and assuming average string length 10, how big could \(B\) get before spilling out of a 32K L1 cache?
Respond at: https://PollEv.com/davidbindel252
or send davidbindel252 to 22333
Ask Me a Question!
Stand on the Shoulders of Giants
Rust: the Fine Methods
- Standard libraries are pretty good!
- Use
Vec,HashMap,BTreeMap,Heap,BinaryHeap - Methods for sort, binary search,
- Use
- Much more at Crates.io
Vet Your Sources
Things to look for:
- Has the package been around a while?
- Is it used by packages you trust?
- Is it actively maintained?
Computational Kernels
Computational kernels are
- Small and simple to describe
- General building blocks (amortize tuning work)
- Ideally high arithmetic intensity
- Arithmetic intensity = flops/byte
- Amortizes memory costs
Case Study: BLAS
Basic Linear Algebra Subroutines
- Level 1: \(O(n)\) work on \(O(n)\) data
- Level 2: \(O(n^2)\) work on \(O(n^2)\) data
- Level 3: \(O(n^3)\) work on \(O(n^2)\) data
Level 3 BLAS are key for high-perf transportable LA.
Kernel Tradeoffs
- Critical to get properly tuned kernels
- Interface is consistent across HW types
- Implementation varies by architecture
- General kernels may leave performance on table
- Ex: General matrix ops for structured matrices
- Overheads may be an issue for small \(n\) cases
Kernel Tradeoffs
Building on kernel functionality is not perfect –
But: Ideally, someone else writes the kernel!
(Or it may be automatically tuned)
Time Before You Tune
Back to Knuth
It is often a mistake to make a priori judgements about what parts of a program are really critical, since the universal experience of programmers who have been using measurement tools has been that their intuitive guesses fail.
- Knuth, Structured programming with go to statements, Computing Surveys (4), 1974.
Hot Spots and Bottlenecks
- Often a little bit of code takes most of the time
- Usually called a “hot spot” or bottleneck
- Goal: Find and remove (“de-slugging”)
Practical Timing
Things to consider:
- Want high-resolution timers
- Wall-clock time vs CPU time
- Size of data collected vs how informative it is
- Cross-interference with other tasks
- Cache warm-start on repeated timings
- Overlooked issues from too-small timings
Manual Instrumentation
Basic picture:
- Identify stretch of code to be timed
- Run several times with “characteristic” data
- Accumulate time spent
Caveats: Effects from repetition, “characteristic” data
Manual Instrumentation
- Instant provides monotonic guarantees
- But may distort time some
- May miss time not resident on CPU (e.g. I/O)
- SystemTime access real-time clock (may be non-monotonic)
Profiling Tools
- Sampling: Interrupt every \(t_{\mathrm{profile}}\) cycles
- We will use
samply
- We will use
- Instrumenting: Rewrite code to insert timers
- May happen at binary or source level
Many tools available (see e.g. Rust performance book)
Time Attribution
May time at function level or line-by-line
- Function: Can still get mis-attribution from inlinining
- Line-by-line: Attribution is harder (re-ordering)
Fallback position: attribution of assembly!
Time Attribution
[profile.release-prof]
inherits = "release"
debug = true
Rust notes:
debug = truein build profile for debugging symbols- Default profile for
releasebuilds without debug - Can add above to
Cargo.tomlfor profiling profile - Use:
cargo build --profile release-prof
More Profiling Details
- Distinguish full call stack or not?
- Flame graphs are nice for the former
- Time full run, or just part?
- Just timing, or get other info as well?
- Heap usage, cache miss counts, …
Hardware Counters
- Counters track cache misses, instruction counts, etc
- Present on most modern chips
- But may require significant permissions to access
- Problematic in some cloud environments
Symbolic Execution
- Main current example:
llvm-mca - Symbolically execute assembly on model of core
- Usually only practical for short segments
- Can give detailed feedback on (assembly) quality
- See next Friday’s lab
Wrap-Up
Summary
Hardware context, some tricks, and some principles:
- Think before you write (today)
- Stand on shoulders of giants (today)
- Time before you tune (today)
- Tune your data structures (next Tue)
- Help your tools help you (next Tue/Thu)
Reminder
- Lab 4 (Fri): Get you set up to profile code on GCE!
- Submission will be via Gradescope (by group)
- P2 check-in (Mon): Blocking transformation
- Prelim (Tue): Rust
Outro
- Ed Thread: What questions do you have for a review?