C-Lab 3 - The Arraylist
CS3410 Spring 2016
Due Friday 04/08.
Please submit required documents to CMS
To receive participation credit, you must sign in!You must work ALONE for this and all other labs and homeworks. Failure to adhere to this rule will result in an Academic Integrity Violation. You will only be able to work in groups for projects. Updates to this assignment will be posted on the course web page.
All of your work should be done on your VM
Overview
In this lab we will implement 3 functions in the file clab3.c for an arraylist of ints: arraylist_add, arraylist_insert, and arraylist_free. You will also gain experience debugging code using GDB.
References. Searching the Internet will generally find an answer to nearly any conceivable question about the C programming language. However, information on the Web is not always accurate or complete. We recommend reference books over web sites. In particular, C: A Reference Manual (5th Edition) by Samuel P. Harbison and Guy L. Steele Jr. is a required textbook for this class and should be your first source for reliable information on C.
The Arraylist
Download the file clab3.c.
Step 1: Implement the arraylist_add(arraylist* a, void* x) function
The elements of an arraylist are stored consecutively in a dynamically allocated array. This function takes a pointer to an arraylist and a value, and appends that value to the end of the arraylist. It should also increment the length of the arraylist to include the new element.
If this is a conceptual drawing of what the arguments to the function look like at the beginning of a call to arraylist_add: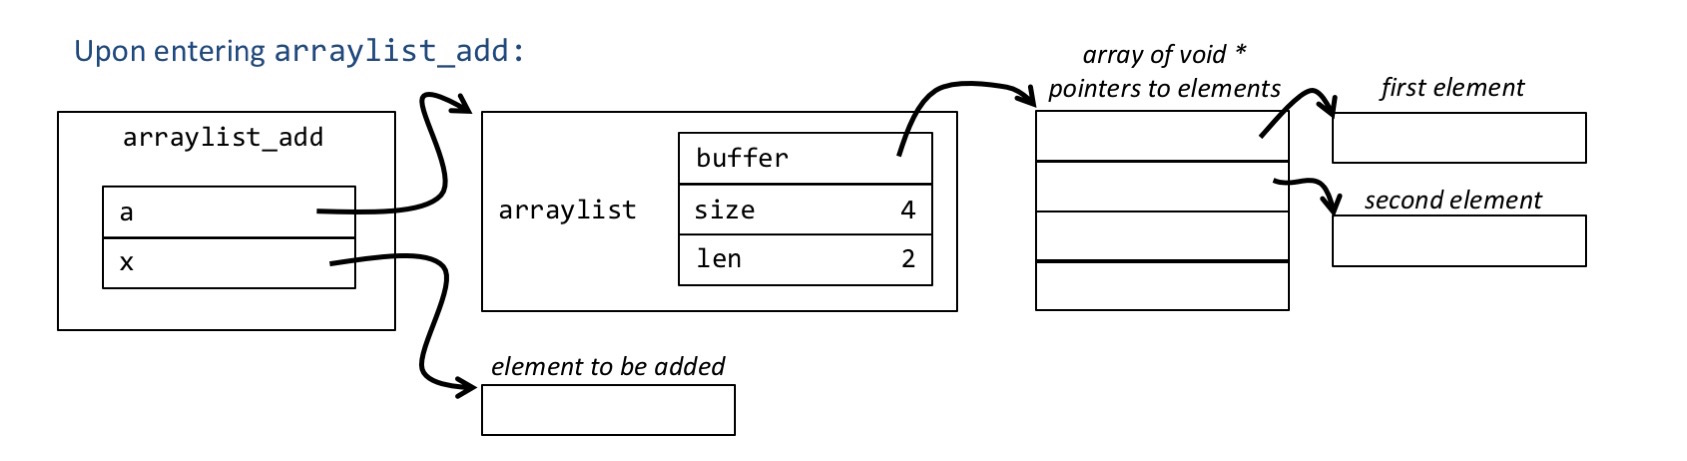
Then this is a conceptual drawing of what the arguments should look like at the end of the function arraylist_add:
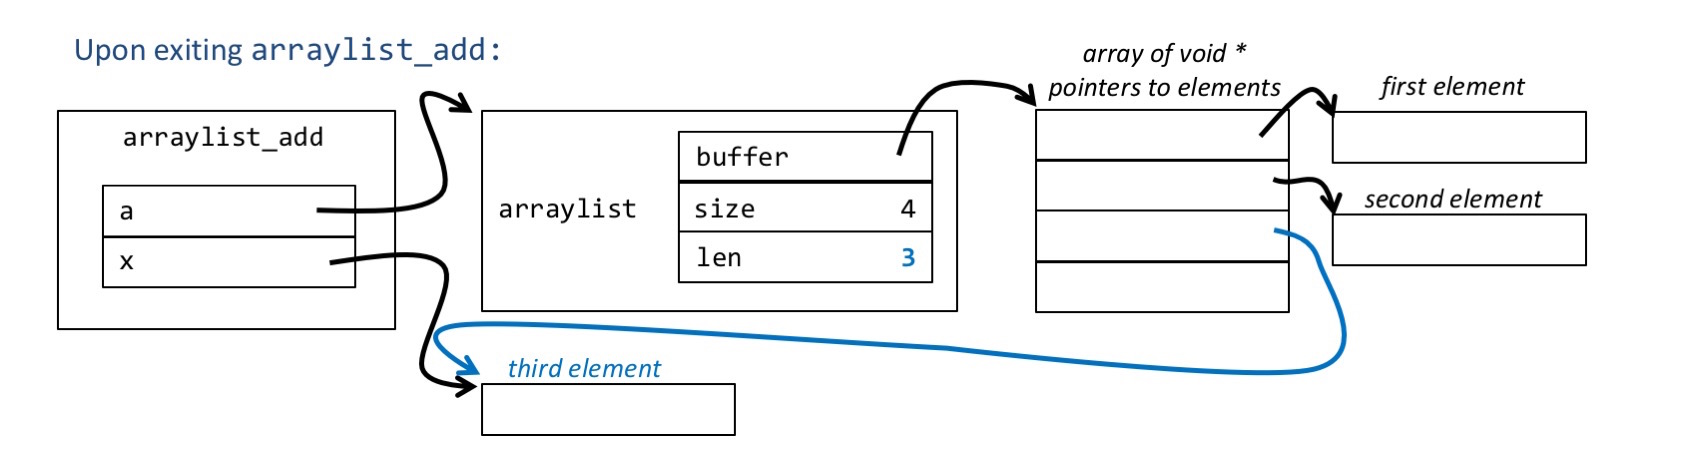
If the arraylist is currently at capacity when arraylist_add is called, you should create a new dynamic array that is twice the size of the old one and copy over all the elements currently in the arraylist. You may find that the standard library function realloc is useful for doing this.
Step 2: Implement the arraylist_insert(arraylist* a, unsigned int index, void* x) function
This function should take advantage of your arraylist_add to insert an element at an arbitrary location in your arraylist. You do not have to worry about attempting to insert to locations beyond the end of the arraylist (doing so it undefined behavior). Hint: Use memmove()
Step 3: Implement the arraylist_free(arraylist* a) function
The arraylist_free simply has to free all the resources used by an arraylist. Note that the arraylist struct contains a pointer!
Step 4: Test
When you are done implementing the functions, compile your program using gcc and run it.
$ gcc -ggdb -Wall -Werror -std=c99 -o clab3 clab3.c
$ ./clab3
The program is meant to output:
[0, 1, 2, 3, 4, 5]
Insert position 0: [100, 0, 1, 2, 3, 4, 5]
Insert position 1: [0, 100, 1, 2, 3, 4, 5]
Insert position 2: [0, 1, 100, 2, 3, 4, 5]
Insert position 3: [0, 1, 2, 100, 3, 4, 5]
Insert position 4: [0, 1, 2, 3, 100, 4, 5]
Insert position 5: [0, 1, 2, 3, 4, 100, 5]
Clean: [0, 1, 2, 3, 4, 5]
Unfortunately, you will discover that the program contains a bug that causes it to print slightly different output. Advance to the next step to discover how to use GDB to find it.
Step 5: Debugging
Start by running GDB with
$ gdb ./clab3GDB will start by printing some license information and loading your program. You will then be presented by a prompt. You can find detailed documentation and tutorials online. Some of the most useful commands are:
- break clab3.c:12 - set a breakpoint on line 12 of file clab3.c
- run - runs your program until a breakpoint or crash is encountered. You can also pause your program by pressing Contrl-C (useful for finding infinite loops). When one of these is encountered, you will be able to inspect the state of your program with any of the following commands.
- continue - continue running your program until another breakpoint is encountered.
- next - execute one line of the current function and then stop
- step - execute a single line of code and then stops. Think of
step as meaning "step into". If you are about to execute the line
of code
printf("hello world\n");next will execute the entire printf function and stop at the line after printf in the file you are looking at. step will try to step into the printf function and excute the first line of code it finds there. If you only "step" through your code, you may find yourself deep inside a library very quickly. And chances are the bug you are looking for is not in the library! Also, if your library was not compiled with debug information, execution proceeds until control reaches a function that does have debugging information, which may result in unpredicatble behavior. Please see this online reference or one like it for full details. - backtrace - displays the call stack for your program.
- frame 4 - moves to a specific frame on the call stack.
- print x - prints the value of expression or variable x.
- quit - close GDB.
break arraylist_print to place a breakpoint at the beginning of the arraylist_print() function. Then type run to start your program. Soon you will find that execution comes grinding to a halt. Type backtrace to see the call stack. You can now use print to view the values of variables. (Go ahead and type print a, which prints a pointer, print a->length, which prints a particular field in the struct that a points to, and print *a, which dereferences the pointer and prints the entire structure it points to.) Pay special attention to the contents of the arraylist. You can continue execution by typing continue. Once you have a theory of what might be going wrong, you'll want to run your program again. This time before doing so, set a different breakpoint in the code where you think the issue might be. Again inspect the program state to see if you've tracked down the problem. If not, try somewhere else in the program and repeat.
Step 6: Valgrind
You should use valgrind to check your code for memory leaks.
$ valgrind -q --leak-check=full ./clab3
When validating memory leaks, make sure you're using valgrind to verify that there are no leaks. However, if you're struggling to figure out the output from valgrind or other errors in your code, we offer another tool on the VM called scan-build (Clang static analyzer). To run this, call (scan-build -k -V ./clab3). It will generate an HTML page that will show existing issues in the code if it can detect some. This tool will not detect all the same issues though that valgrind will, so you cannot rely on it as proof of no leaks in your code.