A5: Search Accelerated

In this assignment you will finish building the search engine that you began in A4.
This assignment is about the same difficulty as A4. On a similar assignment last year, the mean hours worked was 12.4, and the standard deviation was 6.4. Please get started right away and make steady progress each day. Please track the time that you spend. We will ask you to report it.
What you’ll do: Implement red-black trees, and test the performance of your engine.
Table of contents:
- Warning about Academic Integrity
- Step 1: Form a CMS Partnership
- Step 2: Get Started
- Step 3: Finish A4
- Step 4: Red-Black Trees
- Step 5: Performance Testing
- Step 6: Remove
- Rubric
- Submission
Warning about Academic Integrity
This assignment involves implementing some data structures. In the vast expanses of the Internet, there might be an implementation of every known data structure in every known programming language. So it’s conceivable you could just Google for the solutions to certain parts of this assignment. Well, we’ve already done that ourselves and put the results in MOSS, the plagiarism detection software we use. Don’t search for solutions. Just don’t. Once you see someone else’s solution, even just some types or signatures of helper functions, it’s impossible to unsee it; you will almost certainly write code that is too similar to theirs even if you do not directly copy it. A low grade on this assignment is still better than failing the course, which is what could happen if you cheat.
Step 1: Form a CMS Partnership
For your convenience, we have already copied your A4 partnership
over into A5. But if you want to work with someone else, that is fine.
Just make sure to cite any previous partner in your A5 Authors
module in a comment. As with A4, you have until Saturday morning
to form a partnership, and after that, the same penalties will
be in place if you want to change partners. This is to ensure
that if you work with a partner, you really do all the work together
with them instead of one person getting credit at the last minute for
the work of another person.
Step 2: Get Started
First, run opam install csv. That will install a CSV library. You
aren’t required to use that library (in fact the staff solution doesn’t),
but some people in previous semesters wanted to use it, so the release
code this semester depends upon it.
Second, it is highly recommended for the Good scope of this assignment to
install an application named gnuplot. On Linux or Windows/WSL, you can do
that with sudo apt-get install gnuplot. On Mac OS with MacPorts, you can do
it with sudo port install gnuplot.
There is a makefile provided with the usual targets: build, test,
check, finalcheck, zip, docs, and clean. As usual, you may not change
the names and types in the provided interfaces, and your submission must
pass make check. If you’re ever in doubt about whether a change is
permitted or not, just run make check: it will tell you whether you
have changed the interface in a prohibited way. There is a new
target, make perf, which is related to performance testing and
is discussed in that step, below.
You will want to replace the blank implementations in the A5 starter code with your implementations from A4. Here’s how to do that:
- Download the A5 starter code.
- Replace these files with your solution from A4:
dictionarySet.ml,engine.ml,listDictionary.ml,test.ml. - If necessary, copy any new compilation units you added to A4 into A5.
- Copy any test directories that your
test.mlneeds from A4 into A5. - Run
make checkandmake testin A5: all should be good. If not, maybe you modified some other file in the A4 starter code? In which case you’ll need to make the same modification again for A5.
We also provide a Bisect target, as in A4, but the make test and make bisect
targets are factored differently in this assignment than in A4. In A4, make
test linked in the Bisect tool, which meant all your tests were being
instrumented whether you cared about code coverage or not. In A5, make test
does not link Bisect, but make bisect does. The reason for this change is the
performance testing that A5 asks you to do: Bisect greatly slows down your
code, because of the instrumentation it adds, and we don’t want you to have
artificially slow code during performance testing.
Step 3: Finish A4
If there’s anything your didn’t finish in A4, begin A5 by finishing it now. To be clear, your association list dictionary and list-based search engine are a required component of A5. Keep those working as you implement everything else. They will be tested as part of the autograder. If there are test cases you failed on A4’s autograder that aren’t clear, please see a consultant. Please do not post on Campuswire about them.
But, on A5 you are not required to achieve any particular code coverage, or to submit a Bisect report. So if you didn’t do the Excellent scope on A4, that’s fine. You don’t have to finish it for A5. On the other hand, you are encouraged to make use of Bisect as you see fit to help you improve your A5 test suite.
Step 4: Red-Black Trees
The primary performance bottleneck in your search engine so far is the dictionary data structure. In particular,
- the
findoperation on association lists runs in linear time; - the
insertoperation can be as fast as constant time (if you kept the list in unsorted order), but might be slower if you enforced stronger representation invariants (such as sorted order); and - the
removeoperation runs in least linear time—though that operation is not actually needed to implement the engine.
Let’s improve on that by implementing dictionaries with
red-black trees. They offer logarithmic time find, insert, and
remove operations. It’s the faster find operation that will
dramatically improve your search engine. Each node in your red-black
tree will store a single binding from a key to a value, and the
tree will be ordered according to the keys. That is, the binary
search tree (BST) invariant, which red-black trees must satisfy,
will apply to the keys: all nodes in a left subtree must have a key
less than the key at the parent, and all nodes in a right subtree
must have a key greater than the key at the parent.
Implement TreeDictionary by finishing the code in treeDictionary.ml.
But, you should omit remove for now. It is considerably more
challenging, hence will be part of the Excellent scope.
If your engine.ml happened to use remove, you should replace that code now
with another algorithm that doesn’t require remove. Otherwise
you could end up not having a working tree-based search engine, thus not
even getting the points for the Satisfactory scope.
The example in exampleDictionary.ml has been
updated to use TreeDictionary, in case you would again like guidance
on how to create a dictionary in utop.
When you’ve finished implementing
the tree dictionary, the TreeEngine provided in the starter code will
make use of the Engine and DictionarySet modules you already
completed in A4 to produce a fast search engine. So, the only new piece
of implementation for this step is treeDictionary.ml, and the unit
tests that you implement for it in test.ml.
Tip 1. Consider building out your red-black tree in two phases:
-
First, build the representation type for red-black trees, but implement operations that are just the binary search tree (BST) operations, and only enforce the BST invariant. You could arbitrarily color all nodes as black or as red; it wouldn’t matter, because the BST algorithms don’t care about color.
-
Second, enhance your
rep_okandinsertoperations to enforce the red-black invariants.
Tip 2. As you test your tree dictionary and engine, you should be able to re-use your list-based tests. Consider not copy-pasting the tests, but instead using a functor to create a test suite. The input to that functor would be the structure that you want to test, and the output would be a structure that contains a list of OUnit tests. You can then pass that list to the OUnit test runner.
Tip 3. To use TDD, begin by commenting out all your tests you already created for lists. Then uncomment the tests for whatever operation you want to implement next. Implement it for trees. Make sure your trees and lists pass those tests. Repeat until all tests are uncommented.
Tip 4. Use rep_ok to help you. Implement it first. Make
sure all your tree operations check that rep_ok holds of inputs
and outputs. This strategy will make you a more productive programmer:
you will quickly discover your faults and fix them, rather than
having to live with mysterious or unknown faults. After all your tests
are passing, feel free to comment out your (probably expensive) implementation
of rep_ok and replace it with something like let rep_ok x = x,
or even
let debug = false
let rep_ok x =
  if debug then (* your actual implementation *)
  else x
Then later you could quickly re-enable rep_ok by changing debug
to true, if you suspected there was new fault you needed to
diagnose.
Note: Unlike tail recursion, which requires only constant stack space, the red-black tree algorithms require logarithmic stack space. That’s okay. You shouldn’t attempt to rewrite the tree algorithms to use constant stack space.
This is the stopping point for a satisfactory solution.
Step 5: Performance Testing
The reason you just implemented red-black trees was to get better performance. Probably you’ve already noticed that your tree-based tests run faster, especially on large directories. But how do you know that you actually achieved a logarithmic time implementation? Looking at individual running times doesn’t answer that question. Instead, you need to look at how the data structure’s operations scale as the number of items it contains grows larger.
Here are two graphs that show the scaling of list sets vs. tree sets
(i.e., a DictionarySet made from ListDictionary vs. a DictionarySet
made from TreeDictionary):
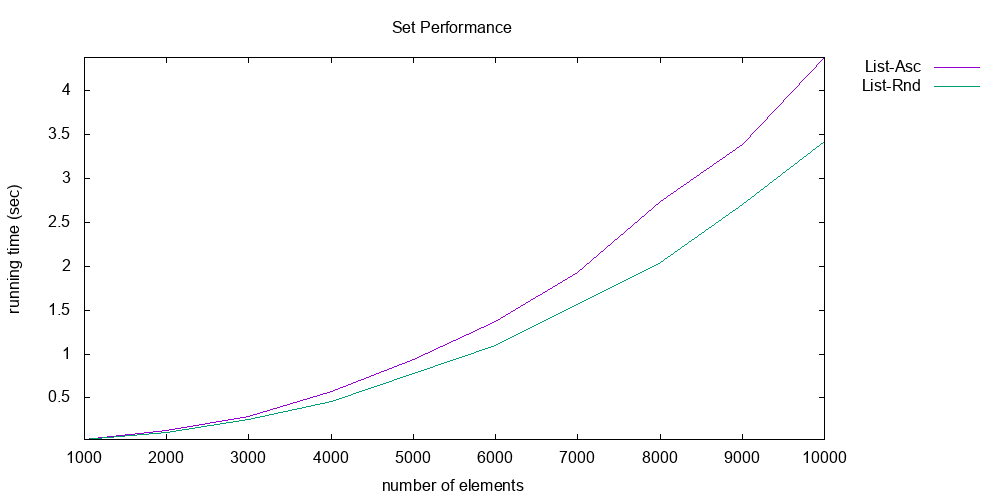
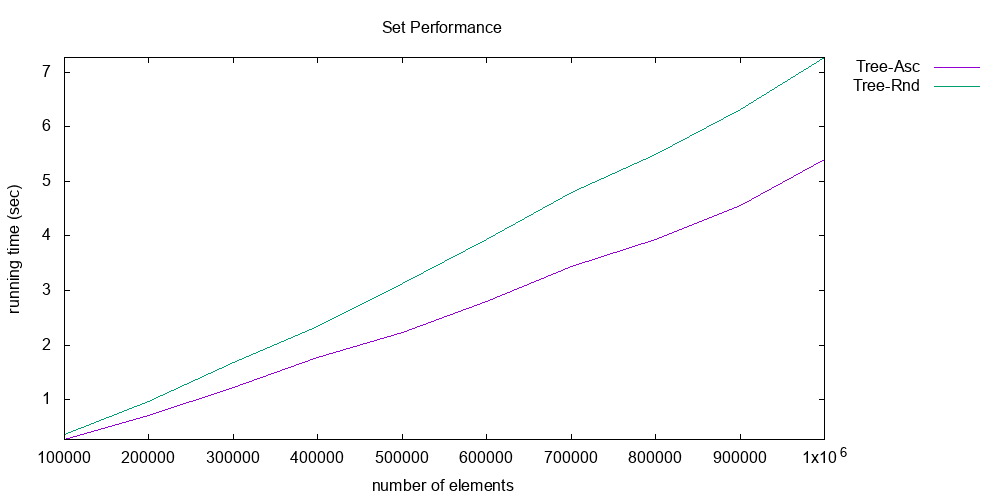
The first graph shows the performance of list sets; the second, tree sets. Note the axes of both graphs carefully: the y-axis is execution time in seconds, and is around 0-7 seconds for both graphs; whereas the x-axis is the number of elements in the set, and is quite different between the two graphs. For lists, the number of elements reaches only 10,000. For trees, it reaches 1,000,000.
The execution time being measured is the time it takes to do the following operations, where \(n\) is the number of elements:
- Insert \(n\) randomly chosen integers into the set.
- Do \(4n\) membership tests, where all those tests succeed.
(Note: that workload will change a little for the Excellent scope.)
Note also that there are two lines shown in each graph. These represent two different workloads: ascending vs. random. In the ascending workload, the elements are first sorted before being inserted. In the random workload, they remain in a random order. As we saw in lecture, the difference between a random workload and an ascending workload matters, because an unbalanced tree data structure would do poorly on the latter.
And every data point reported in the graph is actually the median of three repetitions of the experiment, in an effort to reduce noise.
The list graph clearly shows that the implementation is scaling quadratically: there are \(O(n)\) operations being performed, each of which is \(O(n)\), for a total of \(O(n^2)\) work. But the tree graph is much better: each operation is only \(O(\log n)\), so the total work is \(O(n \log n)\). That’s why the graph looks nearly linear, but has a slight upward curve. The list implementation does slightly worse for the ascending workload; that’s probably because the particular list implementation used in producing that graph keeps the list in sorted order, which causes every insert to take a full \(n\) operations to walk down the whole list. The tree implementation does worse for the random workload; that’s probably because it triggers more rebalancing operations. But in both cases, the two workloads are fairly similar in execution time.
We produced those graphs by writing OCaml code that performs the workloads
and does the timing. That OCaml code wrote out CSV files with the
results. We then used a graphing utility, gnuplot, to create graphs
from the CSVs.
Your task: Do that same analysis for your own implementation. That is,
produce two graphs, each of which shows those two workloads, for the same
maximum values on the x axis. The x-axis of list graph must go to 10,000; and
the tree graph; to 1,000,000. Then explain the results that you see. Submit as
part of your zipfile a file named analysis.pdf that contains your graphs and
your explanation.
What doesn’t matter: The absolute numbers on your y-axis don’t matter. If
your implementation happens to take more like 5 seconds or 10 seconds or 30
seconds, that’s fine. What we’re interested in here is the asymptotic behavior,
not the constants. After all your machine might just be faster or slower than
ours. Also, you don’t have to completely automate your experiments like we did,
or use CSVs, or use gnuplot. But you would be wise to automate as much as you
can, because undoubtedly you will want to run the experiments more than once.
What does matter: We want to see quadratic performance on lists and linearithmic—i.e., \(O(n \log n)\)— on trees, for both workloads. If you aren’t getting those running times, then you have a performance bug, and you need to fix it.
What matters even more: Fabrication and falsification of data is unethical. Science rests upon the honesty of experimenters. If you were to make up or modify the data that you present in your graphs, then you would be in violation of the Code of Academic Integrity. (And if you were a professional researcher, you could get fired.) So just don’t do it. Even if you can’t resolve your performance bugs, it’s better to acknowledge that in your analysis than to lie about your experiments.
Starter code: In performanceTest.ml we provide some starter code to help
you, including generation of random and sorted lists, as well as a function to
time the execution time of other functions. We also provide the two CSV files
for our graphs above and the gnuplot script that produces the graphs from
them, in case you want to attempt the same automation. The make perf target
runs those. It also runs the OCaml native compiler instead of the bytecode
compiler. Native mode produces faster code, which means your experiments will
run more quickly. Using native mode is not required but is likely to be
helpful.
This is the stopping point for a good solution.
Step 6: Remove
All that remains is to implement the remove operation for red-black trees.
This will be perhaps the most challenging Excellent scope yet!
The algorithm you should use is that defined in Section 2 of this short paper by Germane and Might. Although the code in that paper is written in Racket and Haskell, two other functional languages, the algorithm is fully described in English and pictures. So the challenge will be understanding and implementing the algorithm: a challenge that you will likely face in the future in other programming tasks! So, this should be good practice.
There are just two places we found any ambiguity in their description of the algorithm:
-
For their Figures 6, 7, and 9: the double black nodes shown in those could in fact be double black leaves.
-
When they say the
reddenoperation changes the root node to be red “if possible,” they mean: if the root is black with two black children, which themselves are black nodes or (black) leaves. And when they say theblackenoperation changes the root node to be black “if necessary,” they mean: if the root is red with at least one red child.
Also, note carefully when the paper mentions the “reflections” of trees at the bottom of p. 426: your code will need to account for those reflections.
After you have implemented remove (which took us around 100 lines of code,
including modifying the representation type to account for double black nodes
and leaves, and therefore modifying some of pattern matches in the other
operations), make sure that you have tested it. Especially, make sure that you
check for the representation invariant always holding.
Finally, update your performance analysis to include remove in the workload:
- Insert \(n\) randomly chosen integers into the set.
- Do \(4n\) membership tests, where all those tests succeed.
- [new] Delete all \(n\) elements in a random order.
You should still see linearithmic performance.
If you do the Excellent scope, you don’t have to provide separate graphs for both the Good and Excellent scope. Just graphs for the Excellent scope would be fine.
Rubric
- 25 points: submitted and compiles
- 40 points: satisfactory scope
- 20 points: good scope
- 10 points: code quality
- 5 points: excellent scope
Note that there is no testing component to the rubric. Rather, it is absorbed
into the good/excellent scope. The graders will not attempt to run make test
on your submission.
Good Scope (Performance Testing) Rubric.
Your analysis.pdf file will be evaluated against the following criteria:
- There are two graphs, one for lists and one for trees.
- There are two workloads in each graph, ascending and random.
- The list graphs show quadratic scaling and the tree graphs show linearithmic.
- The x axis goes up to at least 10,000 for lists and at least 1,000,000 for trees; both run in seconds (e.g., not minutes nor milliseconds)
- There is a paragraph or two of English discussion of the graphs explaining what the graphs contain, like in the assignment handout above.
Code Quality Rubric. This will be assessed the same as in A4, including documentation.
Submission
Make sure your team’s NetIDs are in authors.mli, and set the hours_worked
variable at the end of authors.ml. Make sure to include only the hours worked
on A5: don’t include A4 hours.
Run make zip to construct the ZIP file you need to submit on CMS.
→ DO NOT use your operating system’s graphical file browser to construct the ZIP file. ←
Any mal-constructed ZIP files will receive a penalty of 15 points. Do not try to
construct the ZIP yourself by hand. Use only the provided make zip command.
Otherwise, your ZIP will potentially contain the wrong files, and you will lose
points—possibly more than just the 15 points mentioned earlier, if you are
missing essential files.
Ensure that your solution passes make finalcheck. Submit your zipfile on
CMS. Double-check before the deadline that you have submitted the
intended version of your file.
Congratulations! Your search has come to an end.
Acknowledgement: Adapted from Prof. Greg Morrisett, Dean and Vice Provost of Cornell Tech.