CS
2110 Homework Assignment 3. Due: Fri 10/9
11:59pm
New! The
test suite has been released.
This
assignment builds on your solution to Assignment 2, and again, you have
permission to work in teams of two if you so desire. Both team members must identify themselves as
part of a team and should hand in the identical solution.
We will make Ken’s solution to Homework 2 available the morning after
Assignment 2 was due. You may use that
as a starting point if your own version of Assignment 1 was hopelessly
broken. However, if you do so, you must
indicate that you based your code on Ken’s solution.
Here are the basic objectives for the assignment:
1.
We’re going to implement a better gene-distance
algorithm, but one that was perhaps a bit too fancy for you to do in A2 when
you weren’t yet familiar with recursion.
2.
We’ll use these better genes to compute
animal-to-animal distances. Basically
these are computed as the sum of gene to gene distances, which each gene in
animal A is matched against the closest gene in animal B, and then vice versa
for B against A.
3.
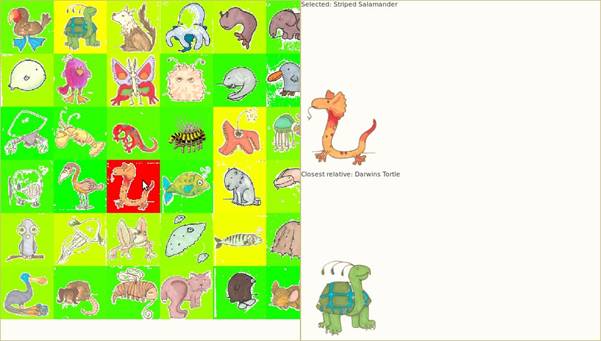
With these animal-to-animal scores, we build a
nice graphical interface that shows all the animals and color codes them based
which ones are closest neighbors and which are further away, and also displays
(for any given animal), it and its closest match off on the right hand side,
with a text string labeling the pictures.
See the example picture on page 3. If there is a tie for closest match, show the
animal with the alphabetically smaller name.
Here’s how we’ll build it. We start with Assignment 2 but using slightly
different animal picture and data files (in a PNG
format that uses transparent backgrounds; the animal data files are actually
the same as from A2, but they use the new animal picture names) and then:
1. We’ll enhance the gene-to-gene
distance algorithm using a slightly fancier form of recursion to get more
accurate scoring.
2. Using our more accurate gene
distances, we’ll compute an array of animal-to-animal distances.
3. Your program will take two arguments:
The first string passed to your main method will be either “console” or “gui”,
and this will determine your program’s behavior. You can use whichever default value you like;
our testing will always supply this argument.
The second string will be the
path to a directory containing species .dat and image files.
a. In console mode, your application
should print a table of animal-to-animal distances in the format we describe
below.
b. In GUI mode you should display a
table of animal images. When the user
clicks on one of the images, the program will highlight the image the user
clicked by re-coloring the background of that picture, and then will show how
far each of the other animals was using other colors on a spectrum – from green
(closest) to yellow (furthest) in our example later in this assignment.
c. Still for the GUI case, your program
should also display the picture of the animal and the picture of its closest
relative to the right of the table of animal pictures.
Note: in A2 we also provided file
names as arguments. In A3 we want you to
search the directory for .dat files and load all the ones you find. See below for details.
Here are the rules for the improved genetic
comparison. You’ll start with the gene
comparison algorithm from assignment 2, which we won’t reproduce here. Recall that a key step in that assignment was
to take the two genomic strings and to put them in a specific order:
sorted by size and then with ties broken alphabetically. After that we had g0 and g1 (notation from
the assignment 2 handout) and ran a matching algorithm that broke each into
three parts: a non-matching gene
sequence (call these a and a’), a matched section 4 or more characters in length
(call it b) and then the remainders of g0 and g1 respectively
(call these d and d’). In assignment
2 we added in the difference computation for (a, a’), ignored (b, b’) and repeated the comparison procedure with g0=d and g1=d’. But we
didn’t resort the genes. This is why we
ended up with a method called Distance (in which we sorted the genes) and a
second recursive one called Distance’ (in which we did the comparison).
The change we want you to make is to compute the minimum genetic distance where you run this computation first on g0,g1 but then a second time on g1,g0, namely with
the longer string “on top” and the shorter one “underneath”. That is, we still use a sorting order to
number the genes, but we don’t use a
sorting step, at all, in the distance computation. Instead, we try both ways and just take
the smaller of the computed distances.
As was the case for homework A2, the computation
itself is repeated. Given our two genes,
we trim off any identical suffix. Now treat
the remaining strings as a sequence consisting of codons that match followed by
codons that differ, perhaps repeated
many times. For each of these sections,
we break off and discard the matching portion, then break off the chunk that
“differs”. We compute the distance score
on the differing pieces (which may be of differing lengths), and then repeat
the calculation on the remaining portions, which start with a section that
matches. Again, you need to try this two
ways: g0’,g1’ and then g1’,g0’, taking the minimum computed distance. Finally, note that in the discussion above,
any of these strings might be empty – we can run out of characters in g0, g1 or
both in the process of doing this computation.
Here’s pseudo-code for how that might look:
Distance(String g0, String g1)
{
g0, g1 =
TrimIdenticalSuffix(g0, g1); // Remove matching
suffix, if any
return min(Distance’(g0,g1),
Distance’(g1,g0));
}
Distance’(String g0, String g1)
{
g0, g1 =
TrimIdenticalPrefix(g0, g1);
// Remove matching
prefix, if any
break g0, g1 into a differing
portion, and two remainders that start with a match
dist =
GeneticDistance(g0DifferingPortion, g1DifferingPortion);
return dist +
min(Distance’(g0Remainder, g1Remainder),
Distance’(g1Remainder,g0Remainder));
}
The computation lends itself to a recursive
procedure. With respect to the version
you created in A2, you can keep the genetic
character counting code, which won’t change, but you’ll replace the
Distance and Distance’ methods you coded for A2 with code that looks somewhat
similar to the code above. Obviously,
the code above isn’t real Java. We left
a bit of work for you to do!
This recursive procedure will give you different
(better) genetic distances than you obtained with the version we used in
homework 2. At the end of this
assignment we recomputed the gene-to-gene distance tables for A1-A2 and even in
this case you’ll see a few changes compared to the ones obtained in Assignment
2. We won’t be testing your gene-to-gene
distance tables this time, but the Animal-to-Animal distances depend on the
gene-to-gene distances, so we’ll have an indirect way to see if you got them
right!
This improved comparison scheme works best with
slightly changed values of the gene distance constants. Here are the values we want you to use:
public class Constants {
public static final int SCOST = 5;
// Gene: Cost
for same characters in different order
public static final int DCOST = 10; // Gene: Cost for different counts but of the same
characters
public static final int DDCOST = 20;
// Gene: Cost
for completely different characters
public static
final int MIN_MATCH = 4;// Sliding window minimum match length
}
So this leads to the Animal-to-Animal distance
computation. As explained in the
homework overview, each animal has DNA and by now we have a list of the genes
that each animal’s DNA contained. Thus
if we have animal A and animal B, we can make lists of the genes that each
animal had in its DNA: perhaps G1, G7 and G8 for A, and G7, G8, G9 and G11 for B.
Our basic scheme will be to first compare the genes in
A to the genes in B, and then do the reverse, comparing the genes in B with the
genes in A, and then to average the two results. In our test data sets, most animals have
approximately 7 genes, but you should not assume that this is the case. Still, it may help in debugging or thinking
about the solution to have those numbers in mind.
To compare two sets of genes (A to B), we’ll maintain a running sum,
score, initialized to zero. For each
gene in animal A, find the closest matching gene in animal B, and add the
distance to the running score (exact matches will have genetic distance zero,
and hence won’t count). We’ll do this
twice: first iterating over the A genes and comparing them against the ones in
B, and then iterating over the B genes and comparing these against the genes in
A. The computed score will be the
average of the two. For example, perhaps
A contains genes G1, G2 and G3 and B contains G4 and G5. So first you’ll look at G1 relative to G4 and
G5 and figure out which it was closest to, perhaps G4. Next you’ll look at G2, perhaps this is also
closest to G4. Add the score to the
score for G1 versus G4. Finally, you’ll
look at G3. Maybe this is closest to G5;
again, add the score. That gives a total
score for A versus B; now repeat for B versus A, average the two, and that’s
our answer.
Hint: We want
animal-to-animal distances to be integers, like the gene-to-gene
distances. No need to use floating point
for these averages (yes, the distances will “round down”, but that’s just
fine).
The Graphical User Interface (GUI)
Similar to assignment 2, your program for assignment 3
will have the option of printing a matrix of comparisons. However, we will also add a graphical
component. Your main method’s first
argument will be either “console” or “gui”.
If the “gui” flag is given, your program will launch into a graphical display
mode. Here are the basic things you’ll
do to create the clickable display and the box where you’ll show the
animal-to-animal distance information.
Here’s how the display will look (note:
the data used for this example was deliberately incorrect: the closest relative of the striped
salamander is actually not Darwin’s Tortle, nor are the other distances
real. Thus the coloring is nonsense).
As noted earlier, to get transparent backgrounds, you
will need to use PNG files instead of the BMP files we supplied for A1. The link is here in case you missed it above.
To help you build this fancy GUI, we have provided an
empty “shell”. You will populate it with
images and teach it how to respond to user events.
1.
Download our
Swing-based GUI shell, cs2110_a3_swing.jar and add it to your Eclipse build path. The API reference is here: cs2110.assignment3.swing. Note: An earlier
version of this assignment used SWT rather than Swing. You can still use the
SWT version
(API
reference)
if you prefer. To switch to the Swing version, simply change
your imports from cs2110.assignment3 to
cs2110.assignment3.swing.
2.
Create a subclass
of cs2110.assignment3.swing.ComparisonGUI
3.
The subclass should
have a main method that takes two arguments---the first is “console” or “gui”,
and the second is the path to a directory containing species .dat files and
images. The main method should behave as
follows when the “gui” flag is given:
a.
Read all of the
species .dat files in the given directory.
Store species information in whatever data structure you think is best;
you may want to create a Species class for this purpose.
i.
Note: We will not
test against malformed data. All species
.dat files will contain an Image command that gives the species’ image filename,
along with a Name and DNA. All image
files are in the same directory as the .dat files.
ii.
Hint: Use the File class to scan the
directory, and the endsWith method of
the String class to check a file’s extension
b.
Compute the animal-to-animal
distance for all pairs of species, as described above. Store this distance in whatever structure you
like (a two-dimensional array is the obvious choice). You should pre-compute all distances because
we’ll be using them a lot, so computing them on-the-fly would be prohibitive.
c.
Create an instance
of your ComparisonGUI and populate it with images using the setCellImage
method. Species should be sorted by name
alphabetically, such that cell 0 contains the alphabetically first species.
d.
Call the run method
to start the GUI!
4.
Override the
onSelectCell method in your subclass.
This is called by the GUI when the user clicks on a cell in the
table. Implement the following behavior
for when a cell is clicked:
a.
The cell that is clicked
becomes the “selected cell”
b.
Change the color of
all cells to reflect their species’ distance to the selected cell’s
species. You may choose your own color
scheme, but please explain your color scheme in the comments of your
ComparisonGUI class. The example uses
red to indicate the selected cell, yellow to indicate closely-related species,
and green to indicate more distantly related species. But any color scheme you like will be just
fine.
c.
Call
setSelectedInfo and setClosestRelativeInfo to set the name and image for the
larger displays to the right of the table.
These displays show the name and picture of the selected species and its
closest relative.
What’s in a Name?
There are several “names” for each animal in our application. One name is associated with the data file:
A0.dat or A17.dat (the name being “A0” or “A17”). A second name is the common-language name in
the “Name command”, like “Name=”Freddy Frog”.
And yet a third name is the fake scientific latin name, like “Frogus
Fredius”.
Our assignment A3 makes use of two of these names. The GUI uses the common-language names and
asks you to sort animals into alphabetical order by name. The animal-to-animal distance matrix should
use the name from the data file: A17 or A6.
That matrix has its rows and columns labeled by the Axx name, in
increasing order by number (the “xx” part),
as seen in the example below.
Why use different names in different situations? This is common in computer science and
relates to the fact that humans tend to be happiest with names that make sense
in English, like Freddy Frog; scientists like the precision of scientific
terminology, and yet computers often find it easier to work with very compact
and regular names like A11 or A19.
So: different naming styles for
different uses!
In A5 this will all come together in our “dendroscope” pictures, which
will be labeled using several kinds of information all at once. But of course we won’t tackle that challenge
for a few more weeks.
Hint for A4: Neighbors aren’t ancestors
This paragraph is aimed towards people who read the master assignment
page and are already thinking ahead about A4.
In a phylogenetic tree, animals
that are close together will often be from the same “generation”. For example, two modern species of ducks
would presumably be more similar to one-another than either would be to a
velociraptor, even if birds are descendents of that branch of dinosaurs (as
some believe to be the case). Here in
assignment 3, we’re finding closest relatives and hence will tend to “group”
animals by generation – the ducks will resemble other birds, the lobsters will
resemble other shellfish, etc. As we
move on to assignment 4, we’ll need to find a different way of computing our
animal-to-animal distances in order to highlight ancestor to descendent
relationships and to deemphasize “sibling” relationships.
What to turn in
Before submitting your assignment, run the test suite. This ensures we will be able to
parse your program’s output for grading.
Export a source JAR containing source code and compiled classes for your
netid.assignment3
package along with your previous assignment packages if you re-used
them. Your main method can be in any
class you choose, but it is very important that
you specify this class as your main class when you export the source JAR. This is done on the third page of the “Export
JAR” dialog. We will release a test
suite before assignment submission is enabled on CMS… you should run the test
suite prior to turn-in to make sure your output formatting is correct.
What we’ll test
We plan to test your animal-to-animal distances
computation in much the same way that we did for Assignment 2 with the
gene-to-gene distances. You should
produce a formatted output containing an animal-to-animal distance table like
the ones shown below (from our in-house solution). We don’t need you to print the genes this
time, but you’ll probably want to do so to debug your code. Our solution does so; from the example below
you can confirm that the program created a single table of genes numbered 0… in
“sorted order” with the shortest genes getting the lowest numbers, and with
ties broken alphabetically.
Notes: Our animal
distances table, below, has the distances “left justified” but you can right-justify
them if you prefer--- it isn’t strictly necessary that your columns line up,
but it will help you check your output against ours. Also: please
use our animal numbering: If you renumber
the animals, our test program will fail.
So: our A17.dat defines animal
A17, etc.
From this table you can see that the Armored Snapper and the Asian
Boxing Lobster are fairly closely related.
Ballards Hooting Crane is clearly a more distant relative; it is
slightly closer to the Armored Snapper than to the Asian Boxing Lobster, but
the match isn’t very good in either case.
Extra Credit (Extra credit only is applied up to the maximum
possible for A3.)
Add either a
"slider" or “scale” widget, with values ranging from 0 to 5000.
If the user slides the bar, for example to d,
find all "families" of animals such that "
Family F, " Animal A,B Î F, AnimalDist(A,B) < d. Thus if d=1000,
we would find some number of families, perhaps 15, such that each family is a
set of animals that are all within distance d of every other member of that
same family. Color each family with a distinct color. As one slides the slider, dynamically recompute
the families and refresh the display accordingly.
Hint: To
create families, iterate over the list of animals in increasing index order:
A0, A1, etc. Figure out if Ai could go
into some existing family according to the rule; if so, add it. If an animal could be in two families, put it
in the family where its average distance from existing members is smaller. If no existing family is suitable, create a
new family for Ai and then move on.
Console Mode Output Format
An example of the console mode output format is below. The first part consists of a gene-to-gene
comparison matrix exactly like in assignment 2, but using the new gene distance
computation. The second part is an
animal-to-animal comparison matrix.
First, print a line that describes each animal and its genes, e.g.,
A0=Armored_Snapper: Genes [0 1 2 7 12 13 16]
Genes are referred to by their positions in the sorted global pool of
genes (7 is G7, etc.). Alternate
formats A0: Armored_Snapper {Genes 0 1 2 7 12 13 16} and A0: Armored_Snapper [Genes 0 1 2 7 12 13 16] are also acceptable.
Then print an animal-to-animal comparison matrix using your species
distance calculations.
As in assignment 2, // and | can be used to leave
comments that will be ignored. Blank
lines will be ignored, and matrix columns do not need to line up perfectly.