Relplot: a general equation plotter
Relplot constructs high-resolution PostScript or PDF plots of the solutions to equations on two variables. Unlike most other plotters, it can handle general equations and inequations, not just functions, and it can plot multiple equations at once and their logical combinations. For more information, see the FAQ.
What can you plot?
- Built-in variables: x y r th θ
- Constants: pi e 2 -.5 1.4e5 .7e01 π
(Note: a comma cannot be used as a decimal point) - Binary arithmetic ops: + * − / ^ mod
- Unary arithmetic ops: |x| sqrt floor
exp ln lg sin cos tan sec csc cot asin acos atan atan2
sinh cosh tanh sinc erf sin^2 cos^2 ... - Relational operators: = < <= > >=
- Logical operators for combining formulas: && & ||
- Multiple equations/formulas separated by commas: ,
- User-defined functions:
f(e1,..., en)
e where f(x1,...,xn) = e'- User-defined variables: a-z
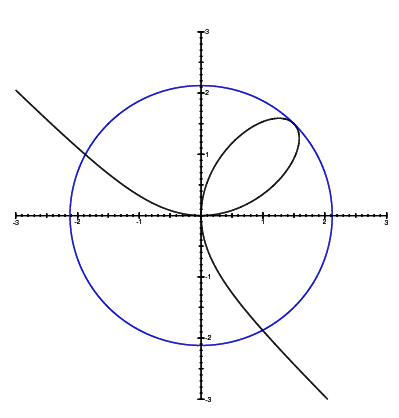
x^3 + y^3 = 3xy, r^2 = 9/2
Some interesting equations to try:
x^2 * y^2 = 1                        x^y = y^x
(r-1/2)^5 = 4yx^3 - 4xy^3            ((xy(x-y)(x+y)(x^2+y^2-4))^2 - 1) < 1
ln r = sin 4x^2 + cos 5y^2 + x/4     y = 3x sinc(pi^2 / r)
y>|x| & y<sqrt(exp x + exp -x - 2)   x^2 <= floor|ay|, x^2>|ay| where a=sqrt(5)
0 = (x^2+(y-(x^2)^(1/3))^2) mod 1    d = 30+sin 90th, d=20, d<10 where d = x^4+y^4
(x mod -y)*(1/y mod .2)=0 && y<0     (5x mod 1=0 || 5y mod 1=0) & r<2
u<sin^2 2v,|r|>2 where u=x+y, v=x-y  f(x-1)mod 1=0,f(4)=4x where f(n)=(r+cos(10th))^2-n
Equation(s) to plot (see above for examples):
Got feedback? Give suggestions or vote on proposed changes.
Relplot was written by Andrew
Myers at Cornell University. It is written in SML and PostScript. The
source code is freely available for noncommercial use, subject to academic
integrity constraints; please contact the author.