
CS 6670 Assignment 1
Di Wu dw323
Table of Contents
|
I started off by modifying the simplified MOPS to include the normalization mentioned in the MOPS paper, then I added gradient orientation information similar to how SIFT uses orientation data, but in a much simpler way. During the down sampling process from 40x40 down to the 8x8 patch, I included as part of the descriptor the angle at pixels. So essentially, the descriptor is the 8x8 normalized pixel data and the 64 gradient orientation at those points.
The orientation data is normalized to mean 0 and standard deviation 1, and then weighted by a 8x8 gaussian to give less weight to orientation at the edge of the descriptor relative to the center.
The choice to include orientation data as part of descriptor is inspired by SIFT. The orientation data can complement the pixel data from MOPS, so it made sense to include it.
This descriptor is not scale invariant because I did not use a image pyramid. To make this descriptor scale invariant, I can use an image pyramid to determine the scale at which the feature point first appears, and than use that scale to take the 40x40 window.
For the Harris corner algorithm, I set an absolute threshold to be average harris value + (max harris value - average)/30, which seems to weed out weak points, and adaptive non maximal suppression helps choose good points out of the candidates. I also enforce that a maximal point be at least 10% higher than its immediate neighbors.
I implemented ANMS so the set of features chosen are much more spread out than would normally be picked.
ROC curve for the Yosemite image
ROC curve for the Graffiti image

AUC data
| Simple + SSD | Simple + Ratio | Custom + SSD | Custom + Ratio |
Yosemite | 0.775791 | 0.771342 | 0.702996 | 0.756386 |
Graffiti | 0.488348 | 0.579295 | 0.547975 | 0.613006 |
Here are ROC curves with MOPS for comparison (right click and view image for full size):
Yosemite

Graffiti

For the Harris corner detector, I’ve implemented adaptive non-maximum suppression, and determined to take the top k features, where k is equal to the image width * height * 0.003.
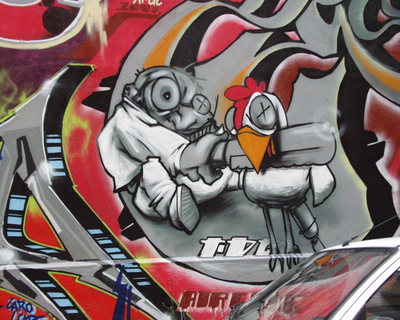
Original Image

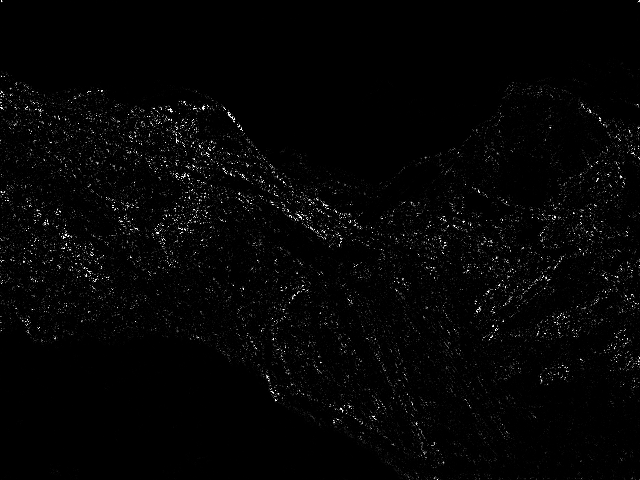
Harris Image

Features
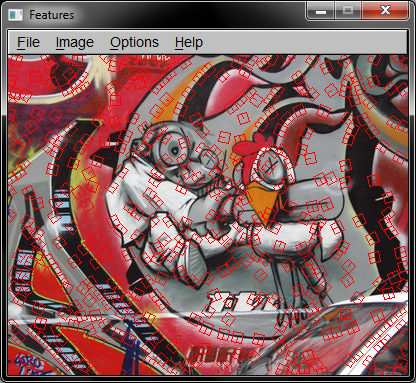

Adaptive non maximum suppression really does a good job of spreading out the feature points in the graffiti example!
Benchmark | Simple Error | Simple AUC | Custom Error | Custom AUC |
Graf SSD | 310.770521 | 0.491480 | 318.701799 | 0.451232 |
Graf Ratio | 310.770521 | 0.493658 | 318.701799 | 0.457580 |
Leuven SSD | 376.937538 | 0.324274 | 232.931964 | 0.485133 |
Leuven Ratio | 376.937538 | 0.475588 | 232.931964 | 0.474925 |
Bikes SSD | 390.424721 | 0.402766 | 227.785220 | 0.492637 |
Bikes Ratio | 390.424721 | 0.492311 | 227.785220 | 0.474837 |
Wall SSD | 387.551881 | 0.311295 | 371.442534 | 0.556694 |
Wall Ratio | 387.551881 | 0.522813 | 371.442534 | 0.519628 |
If we use the AUC as a measurement of algorithm performance, it seems that my custom algorithm performs more or less along the same lines as the simple algorithm (a very disappointing finding). The only instances where my descriptor outperforms the simple descriptor are in the highlighted cases.
Later in the semester, when my C++ skills are better and my understanding of the material gets better, I’m sure I can come up with a better descriptor and really outperform the simple descriptor in all cases.
Matching done using my own descriptor, right click and view image to see full size
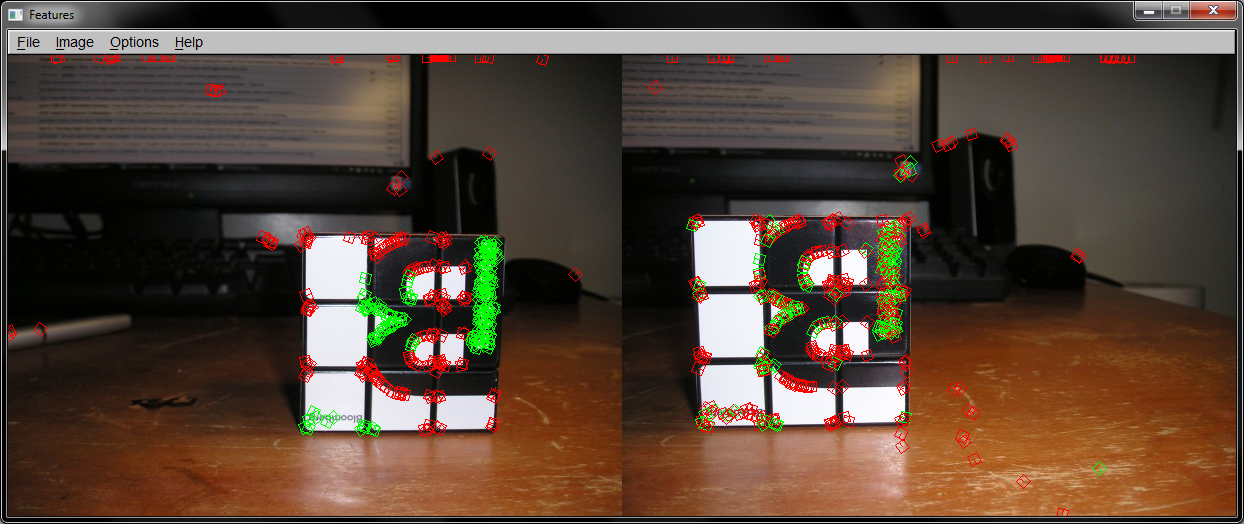


Adaptive non maximum suppression