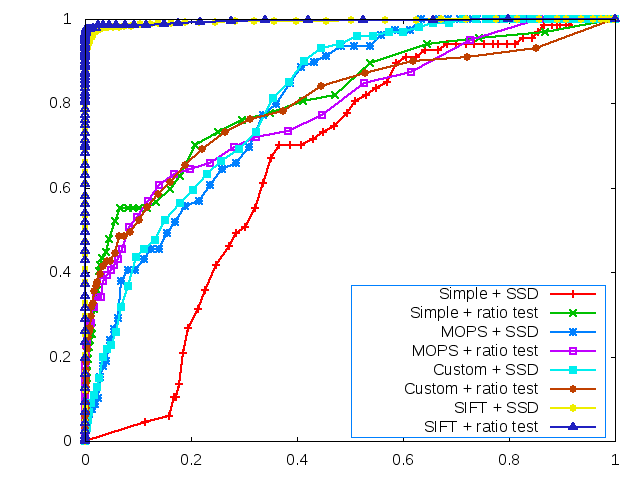
ROC Curve for Yosemite

Harris Values for Yosemite1.jpg

Harrix Feature points for Yosemite 1
submitted by : Sudip Roy (sr577)
Custom Feature Descriptor:
The custom feature implemented is a scale-invariant feature detector and descriptor. For detection a Gaussian pyramid is constructed using the Pyramid functionalities provided in ImageLib. Features are detected for 4 different scales. The feature detection at each scale is based on Harris corner detection. After detection of the feature at each of the scales, the scale at which the Harris operator value is the maximum for a particular x,y position of a feature is chosen. Following the detection of the features, a MOPS descriptor at the scale of the feature is calculated. That is for a feature detected at scale 1 (i.e. half the original size), the MOPS descriptor is computed as 5x5 sample of a 41x41 patch of the half-sized image. The 41x41 is smoothed using a Gaussian filter and then normalized (by subtracting mean and dividing deviation) before subsampling. This allows us to calculate a scale, rotation and illumination invariant feature descriptor.
Major design decisions :
Number of levels to consider : For 4 image levels we detect features at scale factors 0, 4, 16 and 64. Higher levels of image pyramid reduces the size of the image to too small resolution to sample a 41x41 patch.
Choosing 1 scale for feature : A corner is usually going to appear in multiple scales. However, the response in terms of the Harris value is going to be the maximum just for one scale. This is the scale at which the feature is strongest i.e. it is the most distinguishing. To avoid having multiple features for the same corner, other features corresponding to the same corner at not as strong scales were suppressed.
Choice of descriptor : I chose MOPS descriptor as it is rotation and illumination invariant (with normalization). By finding the descriptor at its canonical scale, I could also make the descriptor scale-invariant.
Yosemite:
|
ROC Curve for Yosemite |
|
|
Harris Values for Yosemite1.jpg |
Harrix Feature points for Yosemite 1 |
Graf:
|
ROC Curve for Graf |
|
|
Harris Values for Graf Image 1 |
Harris Feature Points for Graf Image 1 |
Average AUC Values for Benchmarks:
|
|
Simple + SSD |
Simple + Ratio |
MOPS + SSD |
MOPS + Ratio |
Custom + SSD |
Custom + Ratio |
|
Graf |
0.54 |
0.53 |
0.6 |
0.56 |
0.6 |
0.57 |
|
Leuven |
0.08 |
0.58 |
0.37 |
0.54 |
0.48 |
0.59 |
|
Bikes |
0.52 |
0.51 |
0.51 |
0.57 |
0.48 |
0.60 |
|
Wall |
0.32 |
0.55 |
0.56 |
0.59 |
0.56 |
0.59 |
Average Pixel Error:
|
|
Simple + SSD |
Simple + Ratio |
MOPS + SSD |
MOPS + Ratio |
Custom + SSD |
Custom + Ratio |
|
Graf |
317.1 |
317.1 |
283.8 |
283.8 |
282.57 |
282.57 |
|
Leuven |
393.91 |
393.9 |
370.57 |
370.57 |
317.26 |
317.26 |
|
Bikes |
357.6 |
357.6 |
366.55 |
366.55 |
361.2 |
361.2 |
|
Wall |
397.86 |
397.88 |
331.5 |
331.49 |
325 |
325 |
Strength and Weakness:
From the tables above it can be clearly seen that the custom descriptor with the ratio test performs the best on all datasets both in terms of the average auc value as well as the average pixel error. Thus, the strength of custom feature is that it is more robust to scale, illumination and rotational transformations. The weakness is the time required for performing a brute force accurate matching. However, indexing structures like kd-trees can be used to perform approximate nearest neighbor queries to significantly speed up the process of matching features.
Extra Credit:
The custom descriptor uses a Gaussian pyramid with automatic scale selection for achieving scale-invariance.
.png)

