CS 6670 Computer Vision Project 1
Stephen Moseson, scm42
My Feature Descriptor
I
did something similar to the MOPS descriptor, except that instead of storing
the actual pixel intensities, I instead stored the Ix and Iy values. I chose this representation because
the gradients in a descriptor window should be relatively robust to changes in
illumination, as well as position and orientation. Unlike SIFT, my descriptor
contains the exact location of gradients instead.
I
initially wanted to simply store the gradient angle at each pixel location, but
this would introduce a discontinuity in the gap from –pi to pi (or wherever the
angles wrapped around). To get around this I chose to represent the gradient
angle using Euler angles, which are sin and cosines of the gradient angle at a
pixel. These turn out to be simply the Ix and Iy
values, which can easily be found by convolving the original gray-scale image
with a SobelX and SobelY
kernel.
The
rest of my descriptor was found the same way as the MOPS descriptor. I used the
same oriented 41x41 pixel window around the feature, and down-sampled it to an
8x8 feature, first blurring the Ix and Iy
images to avoid aliasing. I stored both the x and y components of the angle in
the descriptor for a total of a 2*64 = 128 dimension feature vector.
After
some testing I discovered this feature representation was slightly better than
MOPS when using SSD matching, and actually worse than MOPS when using ration
matching. Thus, I decided to supplement my feature with the MOPS descriptor
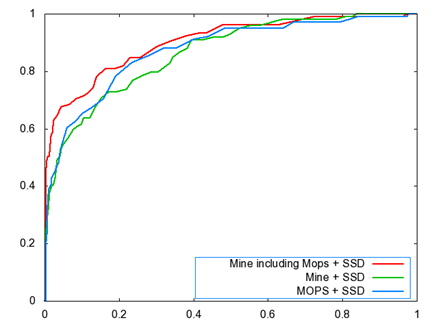
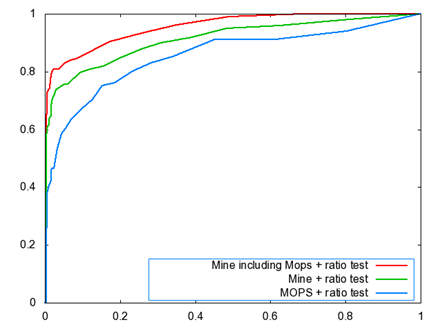
data, and combined them into one descriptor. The results of this descriptor
combining can be seen in Figures 1.
Figure 1: Comparison of MOPS descriptor, my initial descriptor, and a combination of the two.
Thus,
I changed my feature to include the descriptors found from both the descriptor
described above, and the MOPS descriptor. I ran the following benchmarks on
this combined feature, which I will refer to as my feature.
Performance
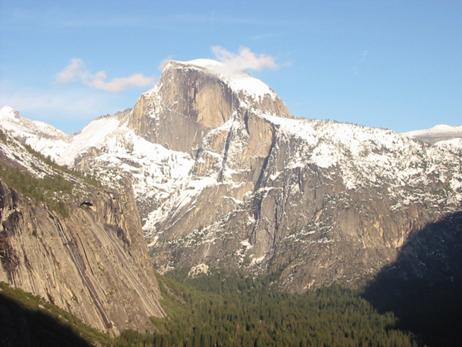
Figure 2: Yosemite ROC Curves
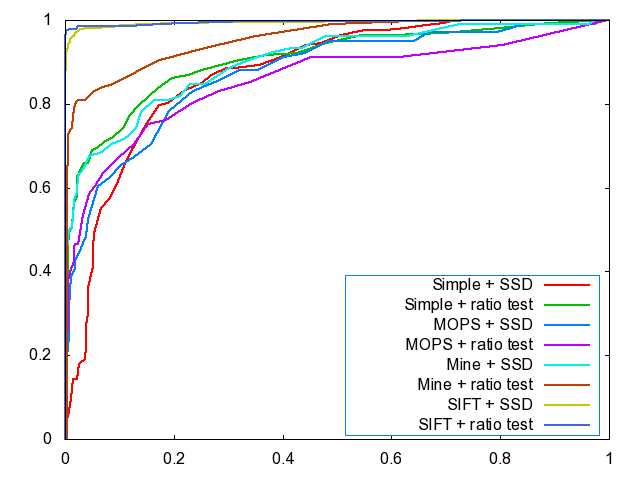
Figure 3: Graf ROC Curves, image 1 to 2
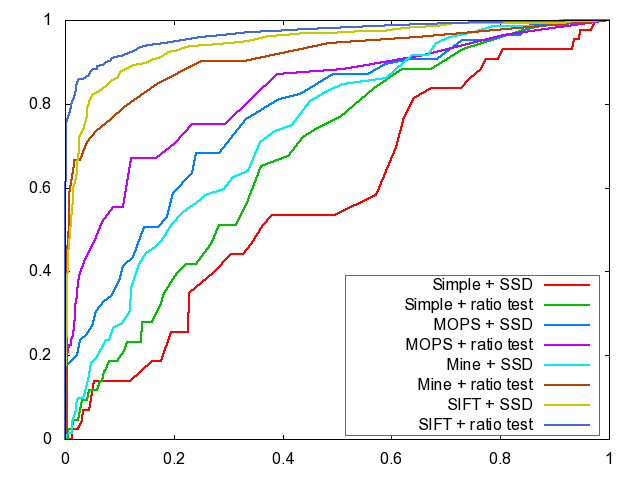
Figure 4: Graf ROC Curves, image 1 to 4
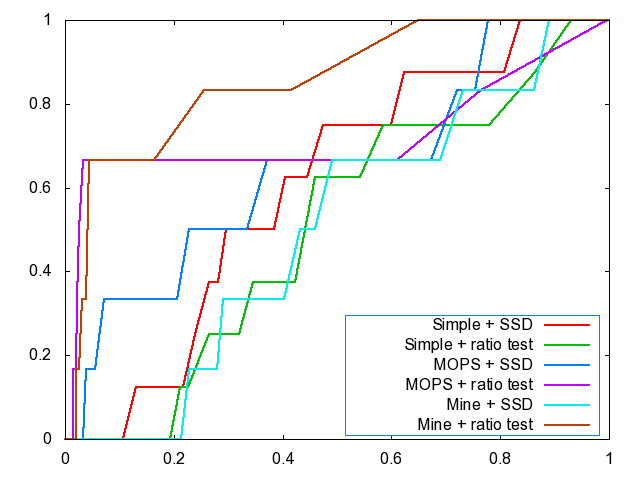
Figure 5: Threshold for Graf (left) and Yosemite (right)
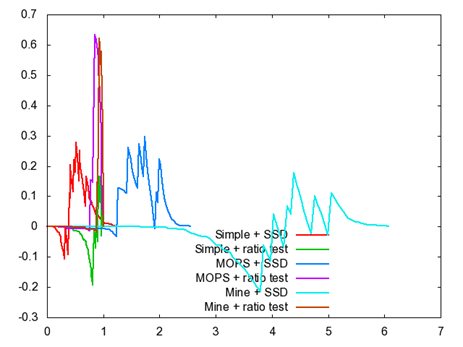
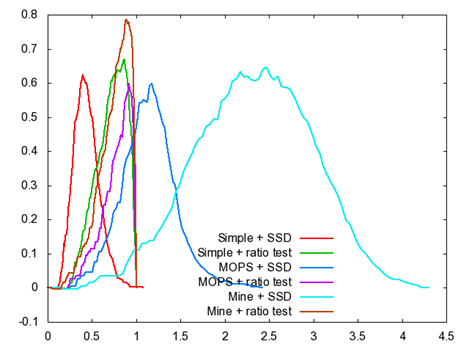
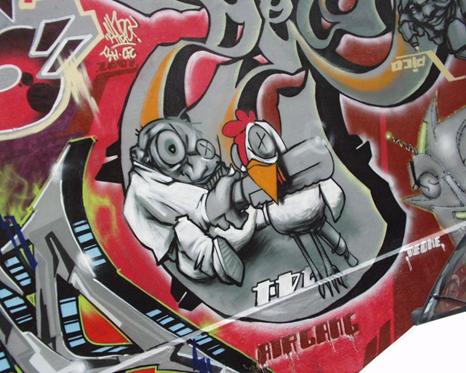
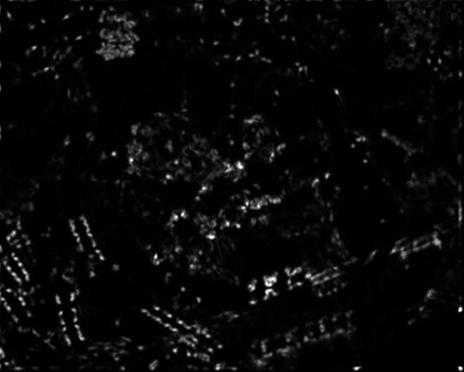
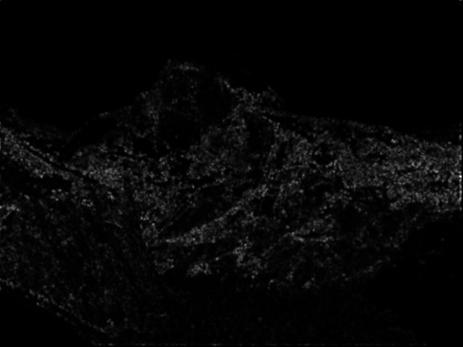
Figure 6: Harris operator images for graf (top) and Yosemite (bottom)
Benchmarks
|
Average
Error (px) |
Average
AUC |
|||||||||
|
Descriptor |
Match |
graf |
leuven |
bikes |
wall |
graf |
leuven |
bikes |
wall |
|
|
Simple |
SSD |
259 |
397 |
483 |
351 |
48.0% |
33.0% |
42.8% |
43.0% |
|
|
MOPS |
SSD |
288 |
375 |
475 |
366 |
58.7% |
30.8% |
64.2% |
57.6% |
|
|
Mine |
SSD |
313 |
278 |
538 |
342 |
48.8% |
48.0% |
52.7% |
63.9% |
|
|
Simple |
Ratio |
259 |
397 |
483 |
351 |
51.4% |
47.2% |
51.6% |
53.6% |
|
|
MOPS |
Ratio |
288 |
375 |
475 |
366 |
54.9% |
55.8% |
58.5% |
54.9% |
|
|
Mine |
Ratio |
313 |
278 |
538 |
342 |
58.8% |
64.3% |
53.8% |
62.4% |
|
My
descriptor outperformed MOPS on three out of four benchmarks when using ratio
matching. It did significantly better in the leuven benchmark, which tests variances in
lamination. My descriptor includes pixel gradient orientation information,
which should remain constant under different lighting. This explains the almost
10% difference between my descriptor and MOPS in the leuven benchmark.
The
instance where it did not do as well was the bikes benchmark. This benchmark
tested the effects of blurring. Blurring an image removes the high frequency
information, which can greatly change a pixel’s gradient orientation. My
descriptor differs from MOPS by including this gradient orientation
information, so when the orientations change due to blurring my feature
detector will perform worse than MOPS.