Note: I did not do any extra credit (as far as I know).
I wanted to design a feature descriptor that was different from anyting we had done in class, and was also invariant to translation, rotation, and changes in intensity. Here's how it works:
This feature detector is invariant to translations because the circles of points around a point remain the same after a translation. It is invariant to rotation because when the circle of points is rotated around the feature point, the same points remain in the circle. Thus, the min, max, and mean values in the circle remain the same. Finally, it is invariant to intensity changes because of the normalization step.
The detector is not very good compared to the other detectors in this assignment. I think it could definitely be made better with parameter tuning. The idea itself could probably also be improved. The detector in its current state does better than the simple detector on some images if ratio test is used (usually worse with just SSD)
Here are some of my major design decisions:
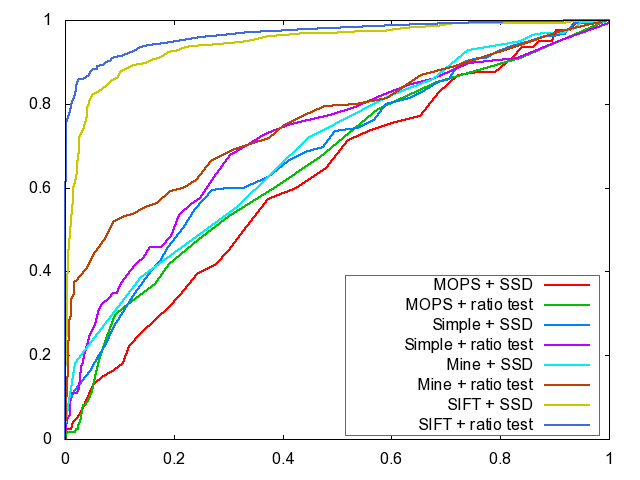
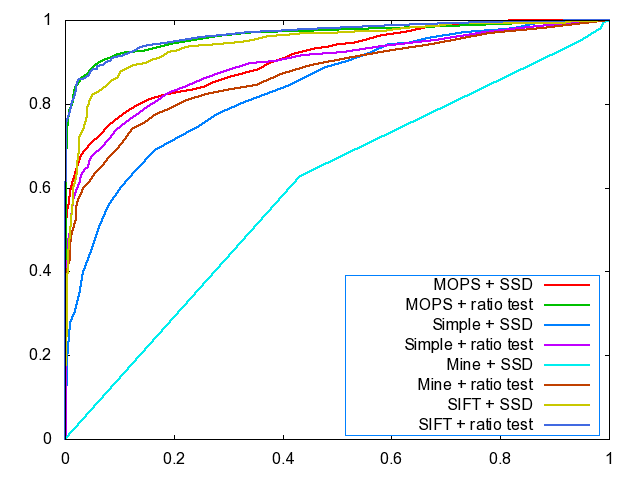
Here are my ROC plots as required:
Images: graf - img1.ppm and img2.ppm
Images: yosemite - Yosemite1.jpg and Yosemite2.jpg
Here are some of my Harris operator images as required:
Image: yosemite - Yosemite1.jpg
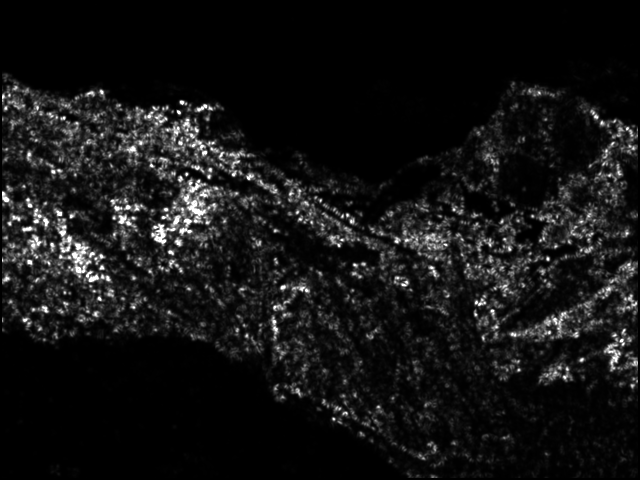
Image: graf - img1.ppm
Here are my AUC statistics (all values are average AUC):
bikes, SSD, simple: 0.266
bikes, ratio, simple: 0.463
bikes, SSD, MOPS: 0.602
bikes, ratio, MOPS: 0.653
bikes, SSD, mine: 0.706
bikes, ratio, mine: 0.553
graf, SSD, simple: 0.577
graf, ratio, simple: 0.513
graf, SSD, MOPS: 0.557
graf, ratio, MOPS: 0.545
graf, SSD, mine: 0.546
graf, ratio, mine: 0.571
leuven, SSD, simple: 0.174
leuven, ratio, simple: 0.515
leuven, SSD, MOPS: 0.574
leuven, ratio, MOPS: 0.700
leuven, SSD, mine: 0.525
leuven, ratio, mine: 0.526
wall, SSD, simple: 0.270
wall, ratio, simple: 0.533
wall, SSD, MOPS: 0.662
wall, ratio, MOPS: 0.702
wall, SSD, mine: 0.553
wall, ratio, mine: 0.569
It was interesting to note that on some of the image sets (for example, graf), the ratio test performed worse than the SSD test. This may have been because the transformations in some image sets were more extreme than others. Image sets with larger transformations seemed to perform worse on with the ratio test.
I didn't have great overall performance (as far as I can tell). It would have taken hours of fine tuning parameters (e.g. local maxima threshold, ratio test threshold) to improve performance.
My feature descriptor worked a lot better when paired with the ratio test (rather than just SSD). I looked into the files and noticed that a lot of the features are very similar (but not the same). This makes sense because there are many patches with similar colors in the images. If we ignore these patches via the ratio test and just match the distinct patches, we get a lot better performance.
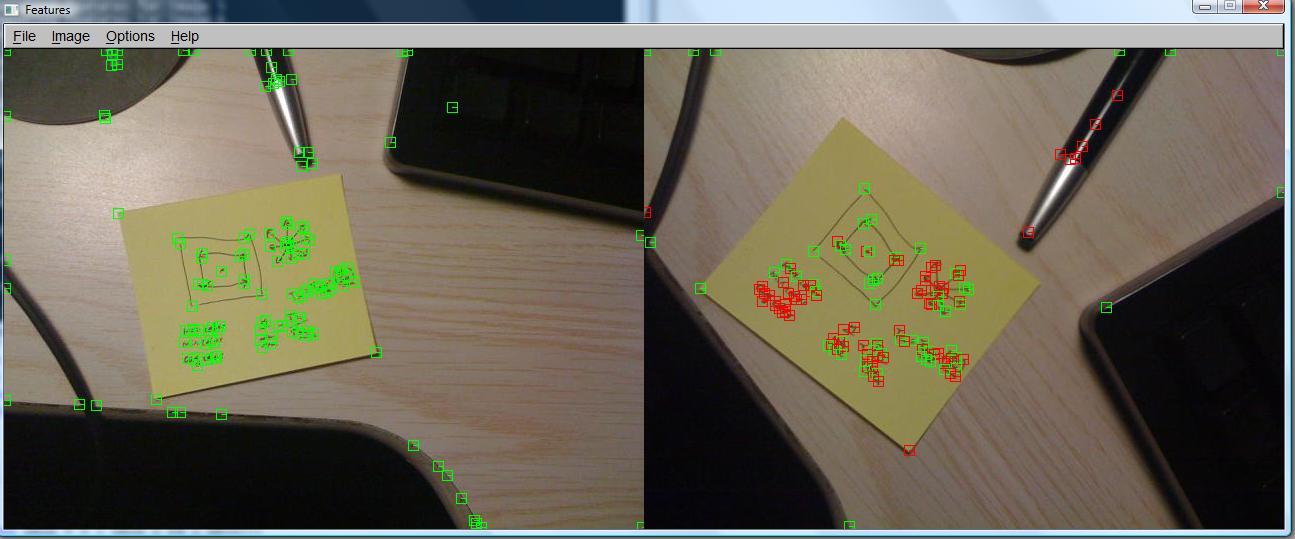
Here is a screenshot of another test that I ran. I was able to match two images that I took of my desk.