T-Th 9:05
or
T-Th 11:15
in Olin 155
CS 1110: Introduction to Computing Using Python
Spring 2014
About: Announcements
Staff
Times & Places
Syllabus
Materials:
Texts/iClickers
Python
Command Shell
Terminology
VideoNote
Handouts:
Lectures
Assignments
Labs
Assessment:
Grading
Exams
Resources:
CMS
Piazza
AEWs
FAQ
Python Tutor
Python Library
Style Guide
Academic Integrity
Assignment 4:
K-means Clustering
Due to CMS by Friday, April 18th at 11:59 pm.
Big Data is a major computer science topic these days. As computers become both ubiquitous and more powerful, many applications — from science to business to entertainment — are generating huge amounts of data. This data is too large to process by conventional means. That means we need new tools (such as new programming languages) and new algorithms to handle it all. The CS department has several upper level courses (such as CS 4780: Machine Learning) dedicated to this topic.
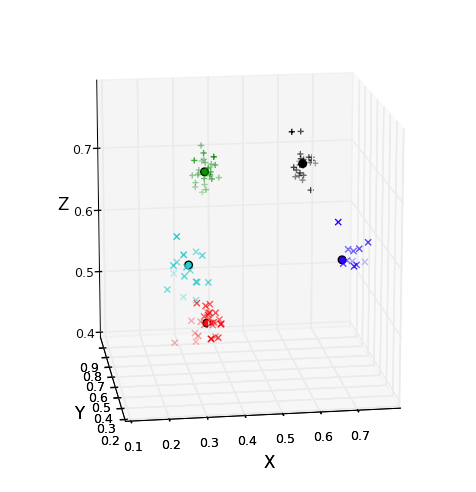
In this assignment you will work with one of the most popular (though not necessarily most efficient) tools for analyzing large amounts of data: k-means clustering. In k-means clustering, you organize the data into a small number (k) of clusters of similar values. For example, in the picture to the right, there are a lot of points in 3-dimensional space. These points are color-coded into five clusters, with all the points in a cluster being near to one another.
If you look at the wikipedia entry for k-means clustering, you can see that it has many, many applications. It has been used in market analysis, recommender systems (e.g., how Netflix recommends new movies to you), and computer vision, just to name a few. It's really an essential tool in one's computational toolbox, and with the skills and knowledge you've been acquiring in CS1110, you're now able to implement it yourself!
Learning Objectives
This assignment has several important objectives.
- It gives you more practice with writing classes and loops.
- It gives you practice with handling items in lists via both direct and indirect references.
- It gives you experience with structuring code, through observing class design and writing helper functions.
- It demonstrates that you have the ability to implement a powerful data-analysis algorithm on real data.
Table of Contents
Authors: W. White, D. Murphy, T. Westura, S. Marschner, L. Lee
- Academic Integrity and Collaboration
- K-Means Clustering
- How to Work on the Assignment
- Recommended implementation strategy
- Finishing the Assignment
Academic Integrity and Collaboration
Please review the CS1110 academic integrity page. Do not forget to cite any relevant sources (documents or people) in your file headers.
You may do this assignment with one other person. Regardless of whether you have grouped with that person for previous assignments or not, if you are going to work together with someone on this assignment, then form your group on CMS for this assignment before submitting. Both parties must perform a CMS action to form the group: The first person proposes, and then the other accepts. Once you've grouped on CMS, only one person submits the files.
K-Means Clustering
In this section, we describe what cluster analysis is, and how we use k-means clustering to implement it.
Cluster analysis is the act of grouping together similar points into groups. When we say point, it could be a 2-dimensional point, a 3-dimensional point, a 4-dimensional point, ... in fact, arbitrary dimensionality can be considered. One application we'll consider in this assignment is clustering for epidemiological purposes: you'll work with data of 2-dimensional longitude-latitude pairs of where birds carrying different strains of avian flu were found, and you'll cluster these into groups that can give insight into different regions where the flu strain appeared.
Distances between points
When we cluster, we will use the Euclidean Distance to measure the distance between points. You may already know how to compute the distance between two 2-dimensional points: \[ d(\mathbf{p},\mathbf{q}) = \sqrt{(p_x - q_x)^2 + (p_y - q_y)^2} \] or between 3-dimensional points: \[ d(\mathbf{p},\mathbf{q}) = \sqrt{(p_x - q_x)^2 + (p_y - q_y)^2 + (p_z - q_z)^2}. \] These are special cases of the general definition: given two \(n\)-dimensional points \(\textbf{p} = (p_1, p_2, \ldots, p_n)\) and \(\textbf{q} = (q_1, q_2, \ldots, q_n)\), the Euclidean distance between them is:
\[ d(\textbf{p},\textbf{q}) = \sqrt{(p_1-q_1)^2+(p_2-q_2)^2+\cdots+(p_n-q_n)^2} \]For example, suppose we have two points: \(\textbf{p} = (0.1,0.2,0.3,0.4)\) and \(\textbf{q} = (0.0,0.2,0.3,0.2)\). Then:
\[ d(\textbf{p},\textbf{q}) = \sqrt{(0.1-0.0)^2+(0.2-0.2)^2+(0.3-0.3)^2+(0.4-0.2)^2} = 0.7071\ldots \]Cluster centroids
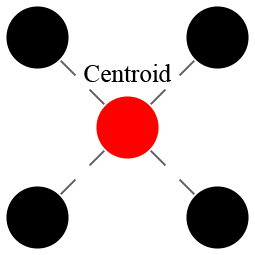
Given a set of points, we can talk about its centroid. The centroid is the “center of mass” of the cluster, which is to say, the average, or mean, of all of the points in the cluster. The centroid might happen to be one of the points in the cluster, but it does not have to be. For example, the picture to the right is an example of a 4-point cluster (black circles) with a centroid (red circle) that is not one of the points in the cluster.
To compute a centroid, we average. Remember that to average, you add up a collection of things and divide by the total. The same is true for points; we add up all the points, and then “divide” the result by the total number of points. Adding two points results in a new point that is the coordinate-wise addition of the two input points:
\[ \textbf{p}+\textbf{q} = (p_1+q_1, p_2+q_2, \ldots, p_n+q_n). \]When we divide a point by a number, the division is done coordinate-wise, as follows:
\[ \textbf{p}/a = (p_1/a, \>p_2/a,\> \ldots,\> p_n/a) \]The algorithm
The idea of k-means is quite simple: each point should belong to the cluster whose mean (centroid) it is closest to. But, the centroid of a cluster depends on which points you put into it. This creates a kind of chicken-and-egg problem, which is solved using an iterative approach: first assign points to clusters, then compute new centroids for these clusters, then re-assign points using the new centroids, and so on.
To make this general idea into a precise algorithm we can implement, let's break down k-means clustering into several steps. Throughout, let \(n\) be the dimension of the points.
1. Pick \(k\) Centroids
We start with the number \(k\). The first step is to guess \(k\) centroids. Throughout these instructions, we will refer to the centroids as \(\textbf{m}_1,\textbf{m}_2,\ldots, \textbf{m}_k\). (The letter m stands for “mean”, or centroid, which is where the algorithm's name comes from.)
Remember that the centroids are themselves \(n\)-dimensional points. Hence, for any mean \( \textbf{m}_j \), we have
\[ \textbf{m}_j = (m_{j,1},m_{j,2},\ldots,m_{j,n}) \]So each \(m_{j,i}\) represents the ith coordinate of the jth centroid.
To pick \(k\) centroids, all we do is choose \(k\) points from our original dataset. We will choose these points at random, as if drawing cards from a deck. This is referred to as the Forgy Method, and it is one of the most popular ways to start k-means clustering.
2. Partition the Dataset
Now that we have \(k\) centroids, we assign every point in the database to a centroid. We do this by matching each point to the nearest centroid \(\textbf{m}_j\), and then have the points assigned to each centroid form a new cluster. This is known as partitioning because each point will belong to one and only one cluster.
If there happens to be a tie between which centroids are closest to a given point, we arbitrarily break the tie in favor of the \(\textbf{m}_j\) with smallest \(j\).
There will then be \(k\) sets \(S_1, S_2, \ldots, S_k\), where set \(S_j\) is the cluster consisting of all the points associated with centroid \(\textbf{m}_j \).
3. Recompute the Means
Once we have the sets \(S_1, S_2, \ldots, S_k\), we need to compute a new mean \(\textbf{m}_j\) for each \(S_j\). This new mean is just the average of all of the points in that set. Let
\[ S_j = \lbrace \textbf{q}_{1},\textbf{q}_{2},\ldots,\textbf{q}_{c_j}\rbrace \]be the set of points associated with centroid \(\textbf{m}_j\), where \(c_j\) is the number of points inside of \(S_j\). Then the new mean is the \(n\)-dimensional point
\[ \textbf{m}_j = \frac{1}{c_j}(\textbf{q}_{1}+\textbf{q}_{2}+\cdots+\textbf{q}_{c_j}). \]The formula above uses the rules for adding points and dividing points by numbers that we discussed above. If you do not understand this formula, please talk to a staff member immediately.
Now, because we have recomputed the means, some points might be closer to the centroid for a cluster they aren't currently in than to the centroid for the cluster they are in. To fix this, we repartition the dataset by going back to step 2 and proceeding as before.
4. Repeat Steps 2 and 3 Until Convergence
The clustering algorithm continues this process: recompute the means and repartition the dataset. The right time to stop is when the means stop changing. If all the means are unchanged after step 3, we know that partitioning again will produce the same clusters, which will have the same means, so there is no point in continuing. When this happens, we say that the algorithm has converged.
Sometimes it can take a very long time to converge — thousands of thousands of steps. Therefore, when we implement k-means clustering, we often add a “time-out factor”. This is a maximum number of times to repeat steps 2 and 3. If the algorithm does not converge before this maximum number of times, we stop anyway, and use the clusters that we do have.
Classes Used in Our Implementation
Classes are ideal for representing complex mathematical objects. For example, we saw in class how to use classes to represent rectangles or times of day. There are several interesting mathematical objects in the description above (points, means, sets/clusters) and we could use classes to represent all of these.
Deciding which of these things to create classes for is the core of object-oriented software design. For this assignment we've made these decisions for you, since it's not always easy to hit the right balance of complexity against structure the first time, and we want you to spend your time implementing rather than redesigning.
For our implementation of k-means, in order to cut down on complexity we decided not to use classes to represent points and means, because Python's built-in lists serve well enough. (In particular, you should not use the Point class in tuple3d. That class only supports 3-dimensional points, but we'd like to support points in any dimension.)
The concepts in k-means that we did decide to create classes for are: the entire dataset, represented by an instance of the class Dataset; a cluster, represented by an instance of the class Cluster; and a set of clusters that organizes the whole database, represented by an instance of the class Clustering.
Points are lists
Throughout this assignment, a point will be represented as a list of numbers; both ints and floats are allowed. This is true for means as well. For example, here is an example of a possible mean if we were working with 4-dimensional points:
\[ \textbf{m}_j \mbox{ is represented as the list } [0.1, 0.5, 0.3, 0.7]. \]
In this example, if x stores the name of the list, then \(m_{j,2}\)
(using the notation from a previous
section) is x[1], or 0.5, while \(m_{j,4}\) is x[3], or 0.7.
Note that our mathematical
notation starts at 1, while list indices start at 0.
Class Dataset
The k-means algorithm starts with a dataset—a collection of points that will be grouped into clusters. This dataset is stored in an instance of the class Dataset. This class is very simple; it just holds the list of points, so its most important attribute is:
- data: A list of points inside this dataset
For example, if a dataset contains the points (0.1,0.5,0.3,0.7) and (0.2,0.0,0.2,0.1), then the attribute data is
[[0.1,0.5,0.3,0.7], [0.2,0.0,0.2,0.1]]
The points are all lists of numbers, and they all have to be the same length; remember that this length is the dimension of the data. We keep track of this dimension in a second attribute:
- dimension: The dimension of all points in this dataset
The fact that all the points are supposed to have the right dimension is expressed by a class invariant: “The number of columns in data is equal to dimension. That is, for every item data[i] in the list data, len(data[i]) == dimension.”
You might argue that storing the dimension separately is redundant, since you could always look at the points in data to find it, but we'd like the dimension to be defined even before we add any points to the dataset.
Class Cluster
The next idea in the algorithm that we have defined a class for is a cluster \(S_j\). To support this type, we defined the class Cluster. Objects of this class will actually hold two different values: the mean \(\textbf{m}_j\) and the set \(S_j\). We do this because the mean and cluster are associated with one another, so it makes sense to store them in a single object. Therefore we need two attributes corresponding to these ideas:
- centroid: A list of numbers representing the point \(\textbf{m}_j\)
- _inds: A list of integers that are the indices where the points of this cluster can be found in the dataset.
Note that we are not storing the points belonging to a cluster, themselves, in instances of Cluster but instead the indices of the points in the dataset. This simplifies Cluster because it doesn't need to worry about maintaining the lists of numbers. Code that works with clusters does need to be able to get to the points, though, so one of its instance variables is a reference to the dataset:
- _ds: The dataset of which this cluster is a subset.
The class Cluster is also the logical place to put code that does computations involving a single cluster. Reading the description of the k-means algorithm above, we find that the two core operations with clusters are computing the distance from a point to a cluster's centroid and finding a new centroid for the cluster. These operations are handled by the two most important methods of the Cluster class:
- A method to find the distance from a point to the cluster (distance)
- A method to compute a new centroid for a cluster (update_centroid)
Class Clustering
Since experimenting with the number of clusters is an important part of using the algorithm, we'll want to create several clusterings of the same data. For this reason, the final class represents a clustering of the dataset: that is, a set of clusters that together cover the whole dataset. The data stored in this class is simple: a list of clusters, and as with Cluster, a reference back to the dataset.- _ds: The dataset we are clustering
- clusters: The list of current clusters \(S_1, \ldots, S_k\)
The methods of class Clustering are the core of the k-means algorithm.
- A method to partition the dataset, implementing step 2 of the algorithm (_partition)
- A helper method for _partition to find the nearest cluster to a point (_nearest_cluster)
- A method to update all the cluster centroids, implementing step 3 (_update)
And finally there are the methods that orchestrate the whole process:
- A method that executes one step of the process, meaning the update of the centroids and the resulting re-partition (k_means_step)
- A method that computes a clustering, from start to finish (perform_k_means)
So a user of the class who just wants to cluster a dataset into \(k\) clusters would create a Dataset, add all the points to it, create a Clustering with \(k\) clusters, and then call perform_k_means on that clustering.
You'll notice that some of the methods have names starting with an underscore. The meaning is the same as with instance variables: these methods are meant to be used internally rather than called directly by code outisde the kmeans module.
How to Work on the Assignment
This assignment involves implementing several things before you'll have the whole method working. As always, the key to finishing is to pace yourself and make effective use of all of the unit tests and the visualizer that we provide.
Assignment Source Code
You should download the zip archive kmeans.zip from this link. Unzip it and put the contents in a new directory. This time, you will see that this directory contains several things:
kmeans.py- This module contains the whole implementation of the clustering algorithm. It is the only file that you will need to modify and submit.
kmeans_test.py- This file is a unit test to provide you with even more help with this assignment. Is not a 100% complete unit test, but you are not required to finish it. We describe this in more detail below.
visualizer_3d.py- This is a GUI that will help you see what is going on, using an example with 3D points. We describe how it works below.
visualizer_map.py- This is a GUI that will let you work with geographic data where the points are 2D and represent (longitude, latitude) pairs. We describe how it works below.
data.a5d- This is a sample dataset for the 3D visualizer. It contains a set of 3-dimensional points with some obvious clusters.
H3N8.avian.usa.csvandH4N6.avian.usa.csv-
These files contain data about influenza in birds; each data point indicates a location where a bird
was found that had a particular strain of avian influenza (bird flu). One might want to understand
geographical differences in what regions these two strains tend to appear in. These
files are in the format expected by the map visualizer. There's a comment at the top of which one
mentioning something arguably interesting about that strain.
One note: these files contain repeated points for when multiple specimens were found in the same location. So the location of a cluster centroid may not be in what looks like the geographic center of its points, because you can't see when multiple points are on top of each other.
These files were created from publicly available data accessible from the Animal Surveillance section of the Influenza Research Database. See Squires et al. (2012) Influenza research database: an integrated bioinformatics resource for influenza research and surveillance. Influenza and Other Respiratory Viruses, DOI: 10.1111/j.1750-2659.2011.00331.x.
Some more files are there to support map drawing:
shapefile.py- This file is an open source library to read geographic data stored in the “shapefile” format. It is used to read the land area shapes that are drawn in the background of the map.
ne_110m_land- This directory contains low-resolution outlines of all major land areas on Earth, from the Natural Earth public domain map, stored in the shapefile format. These are the shapes that are drawn in the background of the map. (The visualizer crops down to just North America, but this would be easy to change if you had some other longitude-latitude data you wanted to work with.)
Pacing Yourself
You should start as this assignment soon as possible. If you wait until the last few days to start this assignment, you will have a hard time getting any help with completing it. If you do one part of it every few days, you will be more relaxed and get it done on time.
At the end of each part, we have a suggested completion date. While this is not enforced, we recommend that you try to hit these deadlines. If you cannot make these deadlines, it might be a sign that you are having difficulty and need some extra help. In that case, you should see a staff member as soon as possible.
Using the Unit Test
We have provided a unit test module that runs the three classes in the kmeans package through their paces. It is split into three phases corresponding to the three classes, which run in the same order we recommend you implement them.
This unit test script is fairly long, but if you learn to read what this script is doing, you will understand exactly what is going on in this assignment and it will be easier to understand what is going wrong when there is a bug. You are encouraged to sit down with a staff member to talk about the unit test, to help you understand it better.
With that said, this unit test is not complete. It does not have full coverage
of all the major cases, and it may miss some bugs in your code. You may want to
add additional tests as you debug, and that is fine. However, we do not want you to submit
the file kmeans_test.py when you are done, even if you made modifications
to the file.
Using the Visualizers
There are two visualizers designed to be run as scripts:
python visualizer_3d.py
or
python visualizer_map.py
The 3D visualizer displays 3-dimensional axes with some buttons and menus to the right. If you click on the window with the plot, you can move the axes. You will find this useful when you are trying to look at three-dimensional data.
The map visualizer displays a map (which will be blank until a dataset is loaded) with the same controls to the right. There are no controls involving clicking on the map itself.
Once you have the assignment completed, you can use these visualizer to perform a k-means clustering on various datasets. Click on the button to select a file, and load the file data.a5d (for the 3D visualizer) or one of the .csv files of flu data (for the map visualizer). Your initialization step will pick \(k\) random centroids. (But since your initialization doesn't partition the data, the data points themselves won't show up yet.)
Then, when you run a k-means step, each cluster will be plotted in a different color, with different marker shapes to aid in distinguishing them. The centroids are larger, black-outlined markers of the same color.
You can use the pull-down menu to change value of \(k\). Whenever you change \(k\), the visualizer will create and initialize a new Clustering. It will also reinitialize when you hit the reset button.
Each time you hit the step button, the visualizer calls Clustering.k_means_step to advance the algorithm by one iteration. You can watch the centroids change as you hit the button. When the algorithm converges, you will see the word "True" after Finished and the step button will no longer do anything.
Recommended implementation strategy
In the file kmeans.py we have provided the definitions for the three classes discussed above, the class invariants and all method specifications; but almost all the method bodies are just stubs. Your task is to implement all the stubbed methods in these classes. We recommend starting with Dataset, since that is needed by the other classes. Then implement Cluster, and test that all its methods are working correctly. Finally implement and test Clustering; when that is working correctly, your assignment is finished.
The Dataset Class
You need to implement two methods for this class, following their specifications.
When you implement the initializer, note that the specification says that the class is supposed to keep a copy of the parameter contents. In this context this means that you need to set the data attribute to a new list that contains copies of all the points in contents. Just writing contents[:] won't do it—that creates a new list that has references to the same points. A question to consider is, how do you copy all those individual lists? You may need a loop of one form or another.
When you implement add_point, be sure that it also adds a copy of the provided point to the dataset.
Testing it Out
Once you complete the Dataset class, you can run the unit test script. If you see output that says
class Dataset appears correct
then you can be pretty confident about this part.
You can also try your code in the visualizers. Run either visualizer and load a data file as described above. The points will only be displayed as black crosses, and the algorithm controls won't work, but you'll be able to see the data. If you click on the Reset button, you will see some error messages in the terminal saying FAILED VISUALIZATION. This is perfectly normal. These error messages are the visualizer letting us know that it was not able to form clusters yet and that it shifted down to testing just the Dataset part of your code only.
Try to finish Dataset by Thursday, April 10.The Cluster Class
The specification for the Cluster class mentions the following instance attributes:
        _ds [Dataset]: the dataset this cluster is a subset of
        _inds [list of int]: the indices of this cluster's points in the
                            dataset
        centroid [list of numbers]: the centroid of this cluster
    Invariants:
        len(centroid) == _ds.dimension
        0 <= _inds[i] < len(_ds.data), for all 0 <= i < len(_inds)
You'll notice that some of the attribute names start with an underscore. This is the standard way to indicate that these attributes are private to this class: code from other classes and modules should not access them directly. For instance, code in the visualizer that needs to know the cluster's centroid should directly read from the centroid attribute, but code that needs access to the data points should use the get_contents method, and should not access the _inds array directly.
Implement the methods in Cluster following their specifications; you'll find __str__ and __repr__ are already implemented.
When implementing get_contents, don't forget that the return value is supposed to be a list containing (copies of) the points themselves, not the indices of the those points. You'll need to loop over the indices, creating copies of the corresponding points from the database and collecting those copies in a newly created list.
When implementing distance, refer to the definition of euclidean distance given earlier in this document.
When implementing update_centroid, which is the most complex function in this class, you will need to first go through all the points, adding up their coordinates: you need the sum of the first coordinates of all the points in the cluster, the sum of all the second coordinates, and so on. Then, after that, you'll need to divide by the number of points in the cluster. Finally, you need to decide whether the centroid has changed. The function numpy.allclose is mentioned in the specification; it is a function that takes two lists of numbers and tells you whether the corresponding numbers from the two lists are all very close in value.
Testing it Out
Once you complete the Cluster class, run the unit test. If everything is working, you will get the appropriate message.
If you run the visualizer, you will see that it has even more functionality. When you load up a data file and click the Reset button, you will see all points in the data set as blue markers in the plot window. In addition, you will see a blue circle with black border representing an initial centroid.
There will still be the error message FAILED VISUALIZATION printed out somewhere in the command shell. This is normal.
Try to finish Cluster by Monday, April 14.The Clustering Class
The last class to implement is the Clustering class. As before, you need to implement the methods following their specifications. The methods in this class do a lot, but because of all the work you did in the lower-level classes, the code for these methods is quite short.
The initializer has the job of setting up the clusters to their initial states so that the first iteration of the algorithm can proceed. Each cluster needs its centroid initialized, but will start with no data points in it until the first partitioning step. You will need to create a list of Cluster objects, and each one needs to be created using a point for its centroid. We draw these points at random from the dataset, but we don't want to select the same point twice, so simply selecting \(k\) random indices into the dataset won't do it.
Fortunately, in the random package there is a function random.sample that selects a number of items from a list. The returned list has no duplicates in it. Use this function to select which points from the dataset will become the seeds of clusters.
The specification for the initializer also supports the caller specifying exactly which points to use as cluster seeds. This is primarily for testing. Your code will have to do something a bit different depending on whether the seed_inds parameter is supplied.
When implementing the _nearest_cluster method, you should use a loop over the list of clusters, since they are the possible candidates. During the execution of your loop, you may want to keep track of both the nearest cluster found so far and the distance to the nearest cluster found so far. An interesting question (with more than one good answer) is what you should initialize these values to.
The _partition method separates all the points into clusters. It can be very simple since the distance computation is already implemented in Cluster.
The _update method involves updating all the clusters, which again is easy because the core operation is already implemented in Cluster. A complication is keeping track of whether all the centroids remained unchanged. One approach is to do something similar to what you did for finding the nearest cluster: keep track of whether a changed centroid has been seen so far.
The k_means_step method is simple once you have _update and _partition. The method perform_k_means basically involves calling k_means_step repeatedly—but you have to know when to stop. This suggests a while-loop with a certain stopping condition.
Testing it Out
The unit test for Clustering tests each of the methods seperately. You can also test this part in the visualizer. When you load a data file, you should be able to run the clustering process: first seeing the inital clusters (once the Clustering initializer is working) and then seeing the process of refining clusters step by step.
If you have a correct implementation, you should be able to visually confirm the operation of the algorithm: after each iteration, each point should have the same color as the nearest centroid.
You might find it interesting to try different numbers of clusters for the avian flu datasets, or to run k-means clustering on them several times, and see how the means move around. Note that if you have “too few” clusters, points that seem far apart end up in the same cluster; but if you have “too many” clusters, you get clusters that seem to lie “too close” to each other. For example, with the H4N6 data, sometimes you get more than one cluster for the Alaska locations, which doesn't seem right; but sometimes you get the Alaska and California points all in the same cluster, which may also not seem right. Cluster analysis can be finicky. But you should often see the algorithm “discovering” clusters that correspond to identifiable geographic regions, which is kind of cool. Do you see any correlation with lakes and waterways?
Finishing the Assignment
Once you have everything working you should go back and make sure that your program meets the class coding conventions. In particular, you should check that the following are all true:
- There are no tabs in the file, only spaces (recall, in Komodo Edit tabs look like arrows if whitespace is visible)
- Functions are each separated by two blank lines.
- Lines are short enough (80 chars) that horizontal scrolling is not necessary.
- The specifications for all of the functions are complete and are docstrings.
- Specifications are immediately after the function header and indented.
At the top of kmeans.py you should have three single line comments with
(1) the module name, (2) your name(s) and netid(s), as well as the identity of any
other sources (documents or people) that contributed to your solution, and (3) the date you finished the
assignment.
Upload the file kmeans.py to CMS by the due date: Friday, April 18th at 11:59 pm.