CS 2110 Homework Assignment 3
Due: Thu 10/7 11:59pm
Description
This assignment builds on your solution to assignment 2, and again you may work in teams of two if you so desire. Both team members must identify themselves as part of a group on CMS, and will jointly hand in one solution. Choose one partner's netID to use when conforming to the package conventions of the course.
We will make a solution to assignment 2 available on CMS to all students who have submitted a solution and received a grade. You may use that as a starting point if your own version of Assignment 2 was hopelessly broken. However, if you do so, you must indicate that you based your code on our solution.
There are three basic objectives for this assignment:
- Recursive gene distances: We're going to implement a better gene distance algorithm, but one that was perhaps a bit too fancy for you to do in A2 when you weren't yet familiar with recursion.
- Species-to-species distances: We'll use these better genes to compute species-to-species distances. Basically, these are computed as the sum of gene to gene distances, which each gene in animal A is matched against the closest gene in animal B, and then vice versa for B against A.
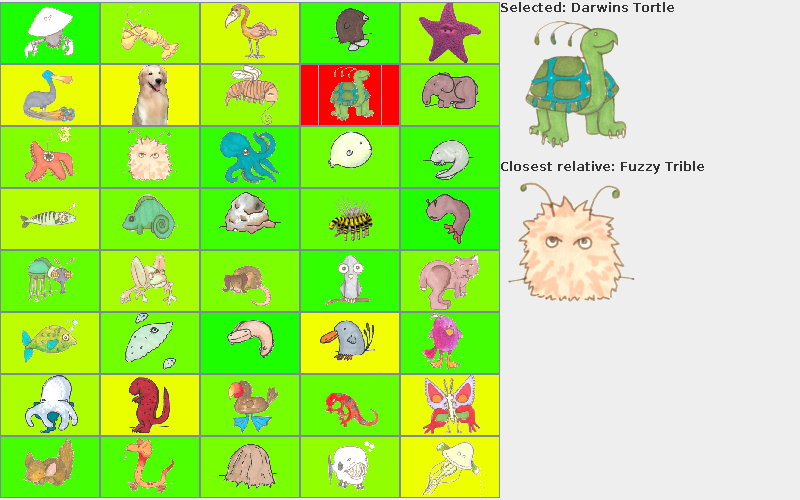
- Graphical user interface: With these animal-to-animal scores, we build a nice graphical interface that shows all the animals and color codes them based which ones are closest neighbors and which are further away, and also displays (for any given animal), it and its closest match off on the right hand side, with a text string labeling the pictures. See the example picture on page 3. If there is a tie for closest match, show the animal with the alphabetically smaller name.
Command-line arguments
Your program will take two arguments (passed to your main method in its args array). The first argument will be either "--console" or "--gui" (note the two dashes in front), which will determine your program's behavior. You can use whichever default you like if neither of these is specified; our testing will always supply this argument. The second argument is the path to a directory containing species .dat and image files.
For both GUI mode and console mode, your program will read all of the .dat files in the directory provided, calculating the all-to-all distance matrix for all genes and species encountered.
We will not test against malformed data. All species .dat files will contain an ImageFilename attribute that gives the species' image filename, along with a Name and DNA. All image files are in the same directory as the .dat files.
Hint: You should only let your SpeciesReader read the .dat files in the specified directory, and not any of the .png files that will be in the same directory! Use the File class to scan the directory, and the endsWith method of the String class to check a file's extension
The behavior of your program for the two different modes of operation is defined below.
Recursive gene distances
You'll start with the gene comparison algorithm from assignment 2. Recall that a key step in that assignment was to take the two genomic strings and to put them in a specific order: sorted by size and then with ties broken alphabetically. After that we had G0 and G1 and ran a matching algorithm that broke each into three parts: a non-matching gene sequence, a matched section 4 or more characters in length, and then the remainders of G0 and G1 respectively. In assignment 2 we employed a "simple distance" computation counting the letters in the non-matching sections on the left, ignored the matching sections, and repeated the comparison procedure on the remainders on the right. But we kept the genes in the same order!
The change we want you to make is to compute the minimum genetic distance where you run this computation first on G0 and G1 but then a second time on G1 and G0 (with the longer string "on top" and the shorter one "underneath"). That is, while we still use a sorting order to number the genes, we don't use a sorting step at all in the distance computation. Instead, we try both ways and just take the smaller of the computed distances.
As was the case for homework A2, the computation itself is repeated. Given our two genes, we trim off any identical prefix and suffix. Now treat the remaining strings as a sequence consisting of codons that match followed by codons that differ, perhaps repeated many times. For each of these sections, we break off and discard the matching portion, compute the distance score on the differing pieces (G0left and G1left), and then repeat the calculation on the remaining portions which come after the section that matches. Again, you need to try this two ways: G0right, G1right and then G1right, G0right taking the minimum computed distance.
Here's pseudo-code for how that might look:
The computation lends itself to a recursive procedure. With respect to the version you created in A2, you can keep the genetic character counting code and the window-matching code, which won't change, but you'll replace the distance and distanceRecursive methods you coded for A2 with code that looks somewhat similar to the code above. Obviously, the code above isn't real Java. We left a bit of work for you to do!
This recursive procedure will give you different (better) genetic distances than you obtained with the version we used in assignment 2. At the end of this assignment we recomputed the gene-to-gene distance tables for A1-A2 and even in this case you'll see a few changes compared to the ones obtained in assignment 2.
Species-to-species distances
Recall that in previous assignments we numbered genes as G0, G1, G2... based on our rules for sorting genes. You'll do the same with species: Species will be numbered S0, S1, S2... sorted alphabetically by their name ("Armored Snapper", "Asian Boxing Lobster", etc.) such that S0 is the first animal alphabetically, S1 is the next, and so on.
As in previous assignments, each animal has DNA and by now we have a list of the genes that each animal's DNA contained. Thus if we have animal A and animal B, we can make lists of the genes that each animal had in its DNA: perhaps G1, G7 and G8 for A, and G7, G8, G9 and G11 for B.
Our basic scheme will be to first compare the genes in A to the genes in B, and then do the reverse, comparing the genes in B with the genes in A, and then to average the two results.
To compare two species (A and B), we'll maintain a running sum initialized to zero. For each gene in animal A, find the closest matching gene in animal B, and add the distance to the running score (exact matches will have genetic distance zero, and hence won't contribute to the distance score). We'll do this twice: first iterating over the A genes and comparing them against the ones in B, and then iterating over the B genes and comparing these against the genes in A. The computed score will be the average of the two. For example, perhaps A contains genes G1, G2 and G3 and B contains G4 and G5. So first you'll look at G1 relative to G4 and G5 and figure out which it was closest to, perhaps G4. Next you'll look at G2, perhaps this is also closest to G4. Add the score to the score for G1 versus G4. Finally, you'll look at G3. Maybe this is closest to G5; again, add the score. That gives a total score for A versus B; now repeat for B versus A, average the two, and that's our answer.
Note:We want species-to-species distances to be integers, like the gene-to-gene distances. No need to use floating point for these averages (yes, the distances will round down if the total happened to be odd, but that's just fine).
Console Mode
Console mode will operate much like assignment 2. You will print a list of all the genes and a gene-to-gene comparison matrix exactly like in assignment 2, but using the new gene distance computation. Then, you will print an animal-to-animal comparison matrix. First, print a line that describes each species and its genes:
Genes are referred to by their positions in the sorted global pool of genes (17 is G17, etc.).
Then print an animal-to-animal comparison matrix using your species distance calculations.
As in assignment 2, // can be used to leave comments that will be ignored. Blank lines will be ignored, and matrix columns do not need to line up perfectly.
Example output is at the bottom of this specification.
The Graphical User Interface (GUI)
Similar to assignment 2, your program for assignment 3 will have the option of printing a matrix of comparisons. However, we will also add a graphical component. Your main method's first argument will be either "--console" or "--gui". If the "--gui" flag is given, your program will launch into a graphical display mode. Here's how the display will look (note: the data used for this example was deliberately incorrect: the closest relative of Darwin's Tortle is not actually Fuzzy Trible, nor are the other distances real--the coloring is nonsense).
To help you build this fancy GUI, we have provided an empty "shell". You will populate it with images and teach it how to respond to user events.
- Download our Swing-based GUI shell, a3.jar and add it to your Eclipse build path. You can do this several ways:
- Import it into your project just as you did with a1.jar: right-click (control-click on Macs) the src directory, and choose Import. Import an Archive file (under General), then find a3.jar and import it.
- Alternatively, since this jar contains compiled .class files and you will simply be extending them, you may add it to your build path. Right click on your project, then choose Build Path-->Configure Build Path. Under the Libraries tab, choose to add a JAR (if you placed a3.jar in your 2110 project's directory) or an external JAR (if you didn't). Choose to add a3.jar to the build path. Now you may use and extend classes in the jar file.
- Whichever method you choose, you should not need to modify these files, and therefore will not need to turn these files back in to us, as we will have them already.
- Refer to the API reference.
- Create a subclass of cs2110.assignment3.ComparisonGUI
- Create a main method that takes two arguments--the first is "--console" or "--gui", and the second is the path to a directory containing species .dat files and images. If the "--gui" option is passed:
- Read all of the species .dat files in the given directory. Store Species information in whatever data structure you think is best.
- Compute the animal-to-animal distance for all pairs of species, as described above. Store this distance in whatever structure you like (a two-dimensional array is the obvious choice). You should pre-compute all distances because we'll be using them a lot, so computing them on-the-fly would be prohibitive.
- Create an instance of your ComparisonGUI and populate it with images using the setCellImage method. Species should be sorted by name alphabetically, such that cell 0 contains the alphabetically first species.
- Call the run method to start the GUI.
- Override the onSelectCell method in your subclass. This is called by the GUI when the user clicks on a cell in the table. Implement the following behavior for when a cell is clicked:
- The cell that is clicked becomes the "selected cell"
- Change the color of all cells to reflect their species' distance to the selected cell's species. You may choose your own color scheme, but please explain your color scheme in the comments of your ComparisonGUI class. The example uses red to indicate the selected cell, yellow to indicate closely-related species, and green to indicate more distantly related species. But any color scheme you like will be just fine.
- Call setSelectedInfo and setClosestRelativeInfo to set the name and image for the larger displays to the right of the table. These displays show the name and picture of the selected species and its closest relative.
What to turn in
Export a source JAR containing source code and compiled classes for your cs2110.netid.assignment3 package along with your previous assignment packages if you re-used them. Your main method can be in any class you choose, but it is very important that you specify this class as your main class when you export the source JAR. This is done on the third page of the "Export JAR" dialog.
Testing
We plan to test your animal-to-animal distances computation in much the same way that we did for Assignment 2 with the gene-to-gene distances. You should produce a formatted output containing an animal-to-animal distance table like the ones shown below (from our in-house solution). We don't need you to print the genes this time, but you'll probably want to do so to debug your code. Our solution does so; from the example below you can confirm that the program created a single table of genes numbered 0... in "sorted order" with the shortest genes getting the lowest numbers, and with ties broken alphabetically.
Extra credit
Add either a "slider" or "scale" widget, with values ranging from 0 to 5000. If the user slides the bar, for example to d, find all "families" of animals such that for each family F, if Animals A, B are both in F, then distance(A, B) < d. Thus if d=1000, we would find some number of families, perhaps 15, such that each family is a set of animals that are all within distance 1000 of every other member of that same family. Color each family with a distinct color. As one slides the slider, dynamically recompute the families and refresh the display accordingly.
How is this done? In the "real world", you might use something like a k-means clustering algorithm to determine the families, but this is a bit too involved for this course, so we suggest this algorithm: iterate over the list of animals in increasing index order: A0, A1, etc. Figure out if Ai could go into some existing family according to the rule; if so, add it. If an animal could be in two families, put it in the family where its average distance from existing members is smaller. If no existing family is suitable, create a new family for Ai and then move on.
Remarks
Hint for A4: Neighbors aren't ancestors
This paragraph is aimed towards people who read the master assignment page and are already thinking ahead about A4. In a phylogenetic tree, animals that are close together will often be from the same "generation". For example, two modern species of ducks would presumably be more similar to one another than either would be to a velociraptor, even if birds are descendents of that branch of dinosaurs (as some believe to be the case). Here in assignment 3, we're finding closest relatives and hence will tend to "group" animals by generation--the ducks will resemble other birds, the lobsters will resemble other shellfish, etc. As we move on to assignment 4, we'll need to find a different way of computing our animal-to-animal distances in order to highlight ancestor to descendent relationships and to deemphasize "sibling" relationships.