
For several reasons, it is desirable to view citation relationship in a graphical form. This M. Eng. project was devoted to that end. It uses an open source visualization package called "Royere" to do the graphing. the source of the citation data was the well-known reference linking service, ResearchIndex. A typical example of a Royere graph is shown below.
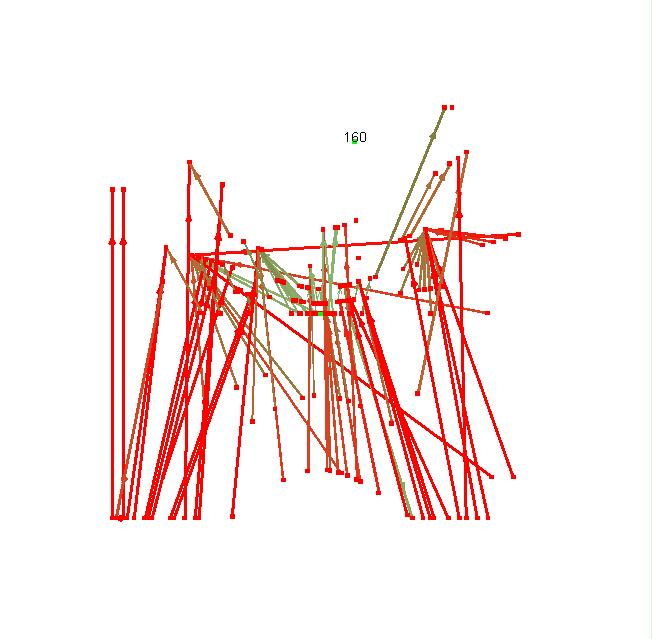
The graph shows what the citations for the topic "Digital Libraries" looks like. Fifty source papers were retrieved, and together with their citations produced a 160-node graph. Xiang arranges the nodes in levels, one year per level. The very top level in the graph contains several papers from 1994. The most recent papers in the graph are from 2001. Nodes whose publication dates are unknown appear on the bottom level.
The input data for the graph visualization program is an XML file containing the nodes and the edges. This particular demo uses GraphXML format, but an simple xslt stylesheet could be used to translate the XML output of the Reference Linking API to the required format. The main thing that Xiang's program does is to prompt the user for a query, then send this query off to ResearchIndex and crawl through the results collecting bibliographic data and citation relationships. This is all written out to the XML file. Finally, the Royere visualizer is launched on that file.
The tool (see Donna Bergmark for a demo) has many visualization features. For example, double-clicking on a node (with "Node labels on click" enabled in the View options), the graph will display a node number alongside. This node number corresponds to a <node> element in the corresponding XML file. This will give the URN of the node (first author's last name-year-first word of title) for further info.
Another nice feature is that you can drag and delete nodes. You can get a "fisheye" view of the graph centered around a selected node. You can even click on a node and see all its citations highlighted (the arcs from the citations to the selected item are highlighted in green.)
Here is a "Molecular Biology" graph, resulting from a user query of Molecular Biology.